 Football matches are filled with excitement and moments of pure joy, as well as times when everything feels utterly awful. That is what a team scoring a goal can do to you, such is the extent to which the emotions of supporters are so closely tied to the outcome of the game that they’re watching. Even people that don’t really care about football aren’t immune from such things, whether because they’ve been caught up watching their national side play or because it matter so much to some that they love.
Regardless of the reason, goals add a huge amount of emotion to a sport that would otherwise entail 22 people run around a football pitch whilst three other people try to ensure that they stick to the rules of the game. A question that you might want answering, whether simply as a supporter or because you’re thinking about putting a bet on it, is how long it usually takes for the first goal to be scored in a football match. Is it quicker for the home team than the away side? All the sort of stuff that we’re going to look at here.
What is the Average Time of the First Goal in the Premier League?
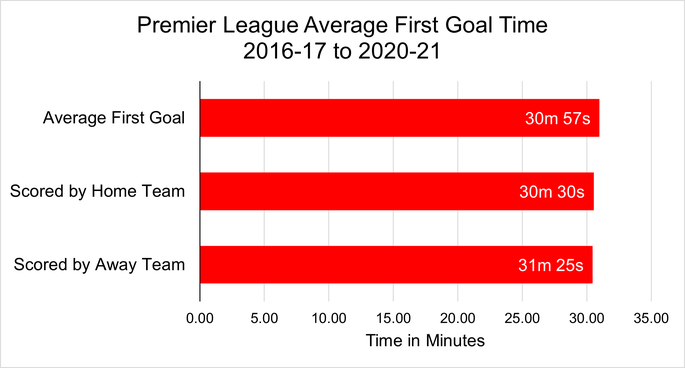
In the five seasons between 2016-17 and 2020-21, the average time for the first goal to be scored was 30 minutes and 57 seconds into the match. That said, more first goals (554) were scored in the first 15 minutes than any other 15 minutes spell within the 90 minutes.
The average first home team goal scored in this time was 38 minutes and 44 seconds, with the average first away team goal on 40 minutes and 36 seconds.
Premier League First Goal Scored
The first place to look when exploring this topic is at the time of the first goal during a football match. This is, of course, different from the first goal scored by the home side or the first goal scored by the away team, given that the home side could be 3-0 up before the away team manages to get on the scoresheet. Here we’ll look at the data from five seasons of Premier League football, exploring the average time for the first goal of the match to be scored, splitting it between those that were by the home teams and the away teams:
Average Time of First Match Goal by Season
| Season | Scored by Home | Scored by Away | All |
|---|---|---|---|
| 2016-2017 | 32:43 | 31:11 | 32:05 |
| 2017-2018 | 31:27 | 33:06 | 32:10 |
| 2018-2019 | 30:28 | 28:52 | 29:44 |
| 2019-2020 | 32:04 | 30:52 | 31:29 |
| 2020-2021 | 25:47 | 33:02 | 29:16 |
To clarify then, the above data is for the first goal scored full-stop, as opposed to the home team’s first goal or the away team’s first goal with other goals having been scored in the game. It is interesting to note that, in three out of the five seasons we looked at, the away team scored before the home team on average. Even so, the combined averages across the five seasons are as follows:
Even though the away team scored the first goal of the match earlier than the home team in three out of the five seasons that we looked at, the average time of the first goal when scored by the home team in the two other seasons was significantly earlier, so as to bring down the average time in the home team’s favour.
Premier League Team First Goal
There is a difference between the first goal of the match and the first goal scored by a team in the match. It is a slightly confusing differential, but it’s important to outline it in order to stop any mistakes being made in the reading of the data. Having looked at the first goal in the game and explained whether it was scored by the home team or the away side, we’ll now look at the average time of the goal scored by each team. That it is say, it will be the first team scored by the home side or the way team, not the first goal scored in the match.
As with the previous data, we’re looking at five specific seasons, starting with the 2016-2017 campaign before making our way to the 2020-2021 one. Here’s the information we have on the matter:
Average Time of Team First Goal by Season
| Season | Home Team’s First Goal | Away Team’s First Goal |
|---|---|---|
| 2016-2017 | 38:58 | 42:06 |
| 2017-2018 | 40:36 | 41:43 |
| 2018-2019 | 38:42 | 39:21 |
| 2019-2020 | 40:48 | 40:21 |
| 2020-2021 | 34:38 | 39:28 |
It is interesting to note that when the away team scores the first goal of the game, they tended to do it quicker than the home team in three out of the five seasons that we looked at. When it is simply the away side’s first goal, however, irrespective of how many times the home team scored or when they did so, the away team takes longer to get the ball into the back of the net in all but one of the seasons that we’re looking at. Here’s a look at the combined averages across all five seasons to indicate the point:
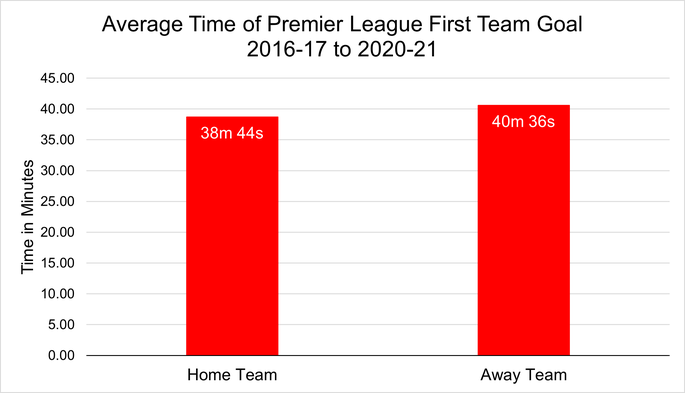
Across five seasons, then, the home team was nearly two minutes quicker at scoring its first goal than the away side could manage. It is obviously not a certainty that the home side will score first, but it’s interesting that their first goal tends to come more quickly than the first goal of the away side. That is something to bear in mind if you’re looking at the likes of the in-play betting market and trying to decide which team will score the next goal. Even if the away side scored early, the home side may well score next depending on the time. More can be found on home advantage in football here.
Time of First Goal Betting
Gambling companies like to offer punters the opportunity to place bets on things that they think will appeal. Obviously the gambling company needs to earn money to survive, so they will often offer markets that people don’t win bets very often in, simply because they know that the bettors will take the bait. One such market is the Time Of First Goal bet, which typically tends be broken up into various brackets of time. Here’s a look at how many goals were scored in each bracket across our chosen five seasons:
Premier League First Goals by Time Period
| Season | 0-15 | 16-30 | 31-45 | 46-60 | 61-75 | 76-90 | None |
|---|---|---|---|---|---|---|---|
| 2016-2017 | 111 | 80 | 77 | 35 | 27 | 23 | 27 |
| 2017-2018 | 101 | 95 | 58 | 42 | 30 | 22 | 32 |
| 2018-2019 | 119 | 103 | 48 | 51 | 18 | 19 | 22 |
| 2019-2020 | 97 | 102 | 78 | 39 | 28 | 15 | 21 |
| 2020-2021 | 126 | 89 | 58 | 38 | 18 | 21 | 30 |
| Total | 554 | 469 | 319 | 205 | 121 | 100 | 132 |
One thing that is worth noting is that goals scored during injury time at the end of the first-half is classified as being in the 31 – 45 minute bracket, whilst those netting in second-half added time are classed as being part of the 76 – 90 minute time period. This is because a goal scored two minutes into injury time in the first-half would be classed as being scored after 47 minutes, which then looks as if it should be in the second time bracket. It is an imperfect system, but it helps to understand why certain goals go in some brackets.
Looking across all of the seasons, you can see that it is actually more likely that there will be no goal scored during the match than that there will be a goal scored in either the 61 – 75 minute bracket or the 76 – 90 minute time period. It is also fair to put your money on a goal being scored in the opening 15 minutes, given that 29.15% of all goals were scored in this time period. It is also interesting to note that the only season in which that wasn’t the period with the most goals scored was the 2019-2020 campaign.
As you will probably remember, the 2019-2020 season was played largely behind closed doors, which might well have resulted in teams being slower out of the blocks than in previous years. The roar of the crowd often gives players an extra boost of energy, regardless of whether they are playing for the home side or the away team, which will allow them to run that little bit faster or hit the ball that little touch harder, leading to a goal and getting the ball rolling in the scores early.
Regardless of the logic, it is clear that bets on opening goals coming within the first 15 minutes of a match will be correct one-third of the time or thereabouts. Obviously that is the average across all teams during the course of the five seasons, but it is something to bear in mind when you’re considering which bracket to place your bet on. It isn’t a perfect system, but it at least gives you a sense of how your wager is likely to pan out.
How About The Championship?
We’ve looked very specially at the Premier League until now, but it is worth having a quick look at the Championship to get a sense of how similar things are in the lower leagues. The second division in England is often considered by many to be even more exciting than the top-flight, simply on account of the slightly lower quality of the teams and therefore the likelihood of more goals being scored.
The question is, are they scored just as quickly as in the Premier League? Here is a look at the time brackets that goals tend to be scored in in the Championship:
Championship First Goals by Time Period
| Season | 0-15 | 16-30 | 31-45 | 46-60 | 61-75 | 76-90 | None |
|---|---|---|---|---|---|---|---|
| 2016-2017 | 150 | 127 | 98 | 58 | 47 | 38 | 34 |
| 2017-2018 | 151 | 132 | 102 | 54 | 34 | 30 | 49 |
| 2018-2019 | 163 | 129 | 90 | 58 | 45 | 27 | 39 |
| 2019-2020 | 177 | 124 | 86 | 58 | 42 | 33 | 32 |
| 2020-2021 | 147 | 127 | 88 | 60 | 43 | 34 | 53 |
| Total | 788 | 639 | 464 | 288 | 211 | 162 | 207 |
Much as with the Premier League, Championship clubs often tend to get the first goal of the game in the opening 15 minutes of a match. In fact, more goals were scored in the first 15 minutes of matches across the five seasons that we’re looking at than were scored between the start of the second-half and the full-time whistle.