 There are any number of bets that you might think about placing where knowledge about the average number of goals scored per game would be helpful information to have. Bets on the Over / Under market are obvious examples, but you might also want to think about the likelihood of a large number of goals being scored before betting on something like a Correct Score market or prior to choosing your scoreline for a scorecast wager. Even having a vague idea will make you feel like you’re on the right track for your bet.
The keyword in all of this is ‘average’, of course. That is the word that reminds us that the number of goals are not certain to be scored in each of the games that we’re betting on. Instead, they’ll average out over a period of time, which is ideal for those of us that like to bet on football matches on a regular basis. We might watch one match and see six or seven goals scored, for example, and then the next game we tune in to bet on could finish 0-0. In other words, there’s a wealth of other things that we need to factor into our bets.
What is the Average Number of Goals Per Game in the Premier League?
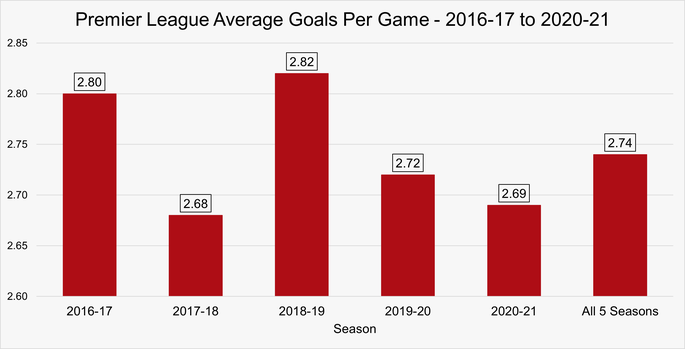
In the five seasons between 2016-17 and 2020-21, there was an average of 2.74 goals scored per game. The 2018-19 season had the highest number of goals per game in this time with 2.82.
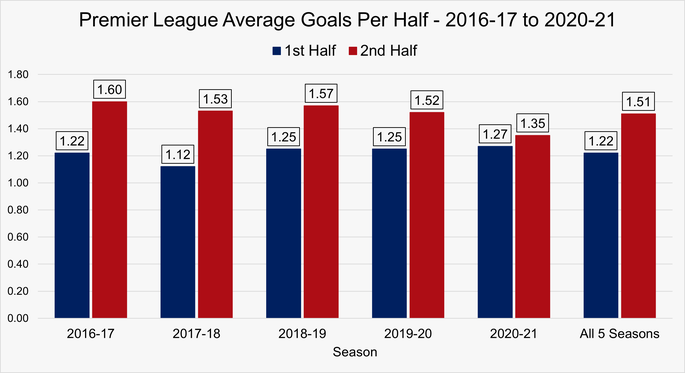
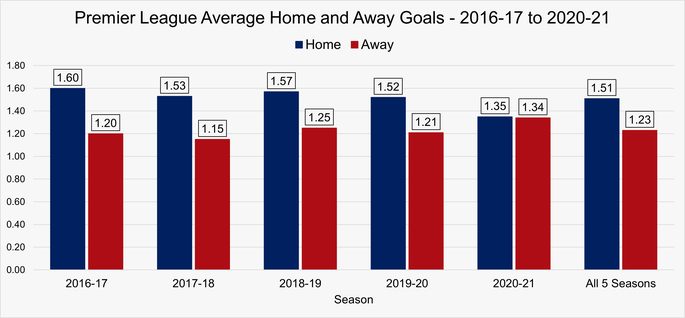
On average during these five seasons, 1.22 goals were scored on average per game in the first half with 1.51 in the second half. The home side scored 1.51 goal per game on average in this period with the away team netting 1.23 goals.
Premier League Average Goals Per Half
Football matches last for two halves of 45 minutes each, with stoppage time thrown in on top of that. Whilst it might seem to us as if most goals are scored in the second-half on account of the fact that we remember the big winning goals, is that actually the case? Or are we just fooled because of the importance of late goals to a football match’s outcome? Here’s a look at the average goals per half for the Premier League, running from the 2016-2017 season right through to the conclusion of the 2020-2021 campaign:

You can see, then, that the numbers back up the idea that more goals are scored in the second-half of matches, on average. There are likely to be a number of reasons for this, with some of them listed below:
- Teams tiring as the match wears on
- Defences losing concentration
- Sides wanting to win & pushing forward, leaving space in behind
- Fresh players coming off the bench
There is no one set reason why matches are more likely to feature goals in the second-half of games and it is obviously the case that some teams will have this happen to them more often than others. Relegation candidates, for example, are much more likely to concede as the match reaches its climax because they simply aren’t as good as the other teams in the division and therefore are less likely to keep clean sheets the longer a game goes on. Equally, the better teams are more likely to score late goals because of their will to win. This is also true of the number of injury time goals, more on which can be found here.
Are Home Teams More Likely To Score Goals?
Just as we assume that late goals are more likely than early ones on account of the fact that import goals scored late in the game stick in our memories more, we’re also inclined to feel as though home teams are more likely to score goals than away teams. We’ve already shown that we are not incorrect in our assumption about late goals, but what about the home team bias? Does the home crowd really make as much of a difference to games as we imagine, or is it slightly exaggerated? Once again, here’s a look at the Premier League over five seasons to answer the question:

It is fairly clear that more goals are scored by the home team on average, but it is maybe not as overwhelming as we might imagine. Some seasons are closer than others, with the 2020-2021 campaign being a bit of an outlier on account of the fact that matches were played behind-closed-doors for most of the season, negating home advantage. Even so, the evidence is there that more goals are scored by the home team than the away side on average. This is something to bear in mind when weighing up your bets. More detail on home advantage can be found in our dedicated article.
Premier League Games Overall
Looking at the detail is all well and good, but what happens when we look at a more macro-sense? After all, if we’re wanting to place a bet on the Over / Under market then getting a clearer idea of how many goals are likely to be scored in 90-minutes plus stoppage time is what matters the most. Here’s a look at the average number of goals scored per match in each of the seasons between 2016-2017 and 2020-2021:

A quick look at the chart above shows that we’re looking at an average of more than two goals per game in the Premier League, irrespective of the season that we’ve looked at. This doesn’t mean that you’ll win a bet if you place Over 2.5 Goals bets in every game, but you’ll win more than you lose. Because it’s an average, what we know is that there will still be some 0-0s just as there will still be some occasions when Liverpool can beat Manchester United 5-0 at Old Trafford, with the scores averaging themselves out over time.
What About The English Football Leagues?
Whilst the Premier League is the pinnacle of football in England, it isn’t the only division in which football takes place or on which you might fancy placing a wager or two. The Championship, League One and League Two all offer plenty of interesting betting matches, but how do they compare to the Premier League? Here’s a look at them all, taking into account the average first-half goals, second-half goals, goals scored by the home team and goals scored by the away team, as well as the overall average for each of the seasons we’ve been looking at:
Championship Average Goals Per Game
| Season | 1st Half | 2nd Half | Home | Away | Total |
|---|---|---|---|---|---|
| 2020-2021 | 1.03 | 1.28 | 1.25 | 1.06 | 2.31 |
| 2019-2020 | 1.14 | 1.49 | 1.41 | 1.23 | 2.64 |
| 2018-2019 | 1.14 | 1.53 | 1.52 | 1.15 | 2.67 |
| 2017-2018 | 1.14 | 1.41 | 1.41 | 1.14 | 2.55 |
| 2016-2017 | 1.09 | 1.52 | 1.50 | 1.11 | 2.61 |
League One Average Goals Per Game
| Season | 1st Half | 2nd Half | Home | Away | Total |
|---|---|---|---|---|---|
| 2020-2021 | 1.24 | 1.39 | 1.35 | 1.27 | 2.62 |
| 2019-2020 | 1.18 | 1.43 | 1.50 | 1.11 | 2.61 |
| 2018-2019 | 1.14 | 1.51 | 1.43 | 1.22 | 2.65 |
| 2017-2018 | 1.10 | 1.43 | 1.38 | 1.16 | 2.54 |
| 2016-2017 | 1.13 | 1.43 | 1.46 | 1.11 | 2.57 |
League Two Average Goals Per Game
| Season | 1st Half | 2nd Half | Home | Away | Total |
|---|---|---|---|---|---|
| 2020-2021 | 1.12 | 1.24 | 1.26 | 1.10 | 2.36 |
| 2019-2020 | 1.12 | 1.40 | 1.40 | 1.12 | 2.52 |
| 2018-2019 | 1.16 | 1.39 | 1.42 | 1.13 | 2.55 |
| 2017-2018 | 1.15 | 1.49 | 1.48 | 1.16 | 2.64 |
| 2016-2017 | 1.13 | 1.52 | 1.42 | 1.23 | 2.65 |
It is fascinating to see that, on average, roughly the same number of goals are scored across the other three divisions of English football. There’s plenty to look at if you drill down into the numbers, but generally speaking you’re looking at more goals scored in the second-half of matches and an excess of goals scored by the home team, regardless of whether you’re looking at the top-flight or the lowest league in English football. There is obviously some helpful information in there in terms of the bets that you might choose to place.
Total Average Goals Scored Across The Four Divisions
The final thing that is worth a look at is the total average number of goals scored per game in all four of the English football leagues. This will obviously give us a sense of whether or not one of the leagues tends to have significantly more goals scored than the others. Bearing in mind this is the average across the five seasons that we’ve investigated, here’s a look at the numbers for first-half, second-half, home goals, away goals and total goals scored:
Average Goals Per Game in the English Leagues
| Division | 1st Half | 2nd Half | Home | Away | Total |
|---|---|---|---|---|---|
| Premier League | 1.22 | 1.51 | 1.51 | 1.23 | 2.74 |
| Championship | 1.11 | 1.45 | 1.42 | 1.14 | 2.56 |
| League One | 1.16 | 1.44 | 1.42 | 1.18 | 2.60 |
| League Two | 1.14 | 1.41 | 1.40 | 1.15 | 2.55 |
Whilst the Premier League sees more goals on average than the other three divisions, it isn’t so outrageously clear so as to suggest that it lightyears apart. The surprise, perhaps, is that across five seasons, League One saw the next more goals scored on average, followed by the Championship and then League Two. In extremely simple terms, therefore, bets on Premier League games featuring Over 2.5 Goals with the home team scoring more often and the goals mostly coming in the second-half are what you want to consider, but always bear in mind the fine margins. A more in-depth comparison of the four divisions can be found here.
