![]() Football fans of a certain vintage will be more than used to the idea of ‘Fergie Time’, which was the injury time added to the end of games that always seemed to last for exactly as long as Manchester United needed to score a goal when Alex Ferguson was the club’s manager. Elsewhere on this site you can read about the average number of goals scored in a match, we also know that more goals are scored in the second-half than the first-half. This is likely because a team will try to win when the end of the match is approaching.
Football fans of a certain vintage will be more than used to the idea of ‘Fergie Time’, which was the injury time added to the end of games that always seemed to last for exactly as long as Manchester United needed to score a goal when Alex Ferguson was the club’s manager. Elsewhere on this site you can read about the average number of goals scored in a match, we also know that more goals are scored in the second-half than the first-half. This is likely because a team will try to win when the end of the match is approaching.
Is the same sort of thing true for when then end of a half is approaching? Obviously a team that needs to win will want to score before the referee blows for full-time, whilst a side that is trailing will put everything into getting level on the scoresheet before the game is over. This seems entirely reasonable, but is it actually backed up by stats? Here we will look specifically at the idea of a goal of any type being scored at the end of a half, during injury time.
How Many Injury Time Goals Are There in the Premier League?
In the five seasons between 2016-17 and 2020-21, there were 432 injury time goals scored in the Premier League. Of these, 225 were scored by the home team, 207 by the away side.
There were 411 matches in this time which featured an injury time goal, which is 21.6% of all games played.
The majority of injury time goals were scored in the second half, 67.1%, with just 32.9% of injury time goals coming in the first half across these five seasons.
What Is Injury Time?

First things first, let’s quickly explain what injury time is. As a football match progresses, the referee will stop his watch when any number of things happen. There is supposed to be a length of time added on when a player scores a goal, for example, as well as when a substitution takes place. Equally, the referee will add time onto the match if a player is trying to waste time, often seen by goalkeepers taking a goal kick or players responsible for taking throw-ins seemingly dragging this simple act out for minutes.
Whilst we say that a referee is adding time on, the truth is that they actually stop their watch. At the end of each half, therefore, the amount of time that should have been played but hasn’t been is added onto the game. This is technically called ‘Added Time’ but is known to most people as ‘Injury Time’ on account of the fact that it is most commonly added based on the amount of time lost to players being treated for an injury. When you consider that, on average, the ball is in-play for around 30 minutes per-half during any given match, referees actually don’t add on as much time as they should.
On the flip side of that is the fact that if football matches actually lasted for 90 minutes then players simply wouldn’t be able to take part in them. With matches tending to last for 30 minutes instead of 45 minutes per half, it is hardly surprising that the idea of playing for an extra 30 minutes in total terrifies most footballer. Referees add on a generic amount of time that they think is suitable, which normally amounts to about 3 or 4 minutes at the end of each half, though typically the second-half gets more time added on than the first for no particular reason.
Which Half Sees The Most Injury Time Goals?
In the Premier League, the football is considered to be exciting and action-packed. As a result, you might imagine that injury time goals are quite common. You’d also be forgiven for thinking that they’d be quite evenly spread, considering the fact that teams are über fit and constantly looking to score. The question is, does that pan out as far as the stats are concerned? Here’s a look at the number of injury time goals scored in each half, for the top-flight across five seasons.
Premier League Injury Time Goals Per Half
2016-17 to 2020-21
| Season | 1st Half | 2nd Half |
|---|---|---|
| 2016-2017 | 35 | 68 |
| 2017-2018 | 26 | 49 |
| 2018-2019 | 23 | 72 |
| 2019-2020 | 33 | 51 |
| 2020-2021 | 25 | 50 |
| Total | 142 | 290 |
The percentages of injury time goals scored in the first half and second half for each of these seasons are shown below.
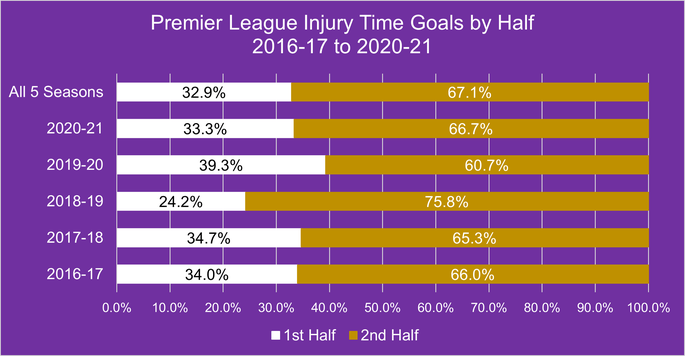
It is reasonably clear that it is the second-half that sees the majority of injury time goals scored in Premier League games. In fact, when we look at the the total number of goals scored in each half’s injury time, you can see that more than twice as many goals have been scored in the second-half when compared to the first over the period of five seasons that we’re looking at. Obviously there has sometimes been more than one goal scored in the injury time period of each half, which is also worth thinking about when looking at the numbers.
Matches When Both Teams Have Scored In Injury Time
There have been eight matches during the course of the five seasons that we’ve been looking at in which both teams have scored a goal in second-half injury time. Despite the long-standing idea that it is Manchester United that take advantage of the referee’s added time, it is actually Liverpool that have been involved in such games. Here’s a look at each of them, giving you a little bit more of a sense of what has happened and whether or not it has mattered to the overall outcome of the match:
Premier League Games With Both Teams Scoring in Injury Time – 2016-17 to 2020-21
| Date | Home Team (Time) | Away Team (Time) | Final Score | Outcome Effected? |
|---|---|---|---|---|
| 26/09/2020 | Brighton (90+5) | Manchester Utd (90+10) | 2-3 | Yes |
| 10/03/2019 | Liverpool (90+3) | Burnley (90+1) | 4-2 | No |
| 09/02/2019 | Southampton (90+1) | Cardiff City (90+3) | 1-2 | Yes |
| 19/01/2019 | Liverpool (90+3) | Crystal Palace (90+5) | 4-3 | No |
| 04/02/2018 | Liverpool (90+1) | Tottenham (90+5) | 2-2 | No |
| 22/10/2017 | Everton (90+3) | Arsenal (90 & 90+5) | 2-5 | No |
| 05/03/2017 | Tottenham (90+2) | Everton (90+3) | 3-2 | No |
| 22/01/2017 | Arsenal (90+8) | Burnley (90+3) | 2-1 | Yes |
If ever you needed proof of the excitement of the Premier League then it can perhaps be seen in these eight matches. Teams keep fighting right until the end, even if the scoring of the goals actually made no difference to the eventual outcome of the match in some cases, on account of the fact that they were either consolation goals or else they cancelled each other out and the result didn’t change from before the goals were scored to afterward. It is also interesting to note that ‘Fergie Time’ is alive and well with Man United’s goal ten minutes after the 90 were up.
How Many Matches Featured An Injury Time Goal?
As you might imagine, matches in which both teams score a goal in injury time are not all that common. The question then becomes, how many matches in a Premier League season featured an injury time goal in either half? Here we’ll look at the number of games out of 380 during each top-flight season between 2016-2017 and 2020-2021 featured an injury time goal, breaking it down according to whether it was scored by the home of the away team and tell you what percentage of games featured a goal in either half’s injury time:
Premier League Matches with Injury Time Goals – 2016-17 to 2020-21
| Season | Home | Away | Total (% of games) |
|---|---|---|---|
| 2020-2021 | 30 | 41 | 71 (18.68%) |
| 2019-2020 | 42 | 36 | 78 (20.53%) |
| 2018-2019 | 49 | 43 | 92 (24.21%) |
| 2017-2018 | 43 | 30 | 73 (19.21%) |
| 2016-2017 | 51 | 46 | 97 (25.53%) |
| Total | 215 | 196 | 411 (21.63%) |
On average, then, around a fifth of all games in the Premier League will see a goal scored during injury time. Little wonder that it is considered to be the most exciting league in the world. It also makes a mockery of the people that choose to leave the match early in order to beat the traffic, considering that there is a one-in-five chance that they’re going to miss a goal being scored. Having paid all of that money, imagine leaving early and seeing a crucial goal being scored just so that you can get home a few minutes early.
Number Of Goals Scored In Injury Time
We know which half of football sees the most goals scored, but how many goals tend to be scored in injury time each season? How many of them are scored by the home team and how many are away team injury time goals? Here’s a look across our five Premier League seasons.
Premier League Injury Time Goals – 2016/17 to 2020/21
| Season | Home | Away | Total |
|---|---|---|---|
| 2020-2021 | 31 | 44 | 75 |
| 2019-2020 | 45 | 39 | 84 |
| 2018-2019 | 50 | 45 | 95 |
| 2017-2018 | 45 | 30 | 75 |
| 2016-2017 | 54 | 49 | 103 |
| Total | 225 | 207 | 432 |
On top of that, what percentage of the total number of goals scored in a season find the back of the net during the stoppage time at the end of each half?
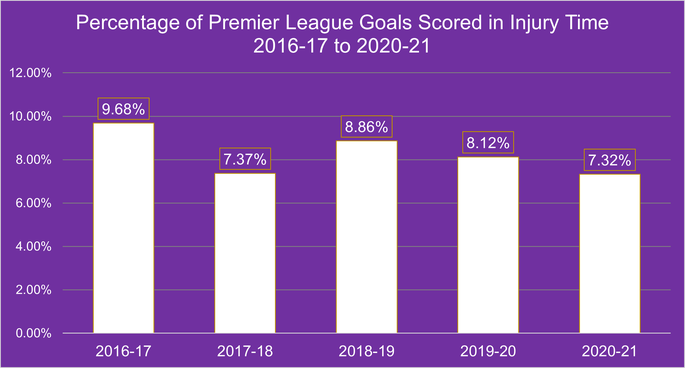
With the exception of the 2020-2021 season, the majority of which was played behind closed doors, the home side scores more injury time goals than away teams tend to do. It is just shy of 10% of the total number of goals that come during injury time across the Premier League, so it’s fair to say that matches are never over until they are over. If the score line is close, expect the home team to push on and try to get one more goal that might make all of the difference to the outcome of the game.