 The National Football League (NFL) is one of America’s most-loved sports, with players paid huge amounts of money to compete at the highest level. The NFL itself is split into two halves, with the American Football Conference involving 16 teams and the National Football Conference seeing another 16 compete. The best teams from each conference go on to compete in the Super Bowl, which is designed to see which conference has the best team. The popularity of the NFL means that we’re looking at different aspects of it.
Elsewhere on the site, for example, you can look at the average number of points scored across past NFL regular seasons, breaking it down into the AFC and the NFC, as well as a look at which teams tend to do the best. There is also a piece about the highest and the lowest number of points scored in Super Bowls, which is an interesting look at what you can expect if the game is either incredibly exciting or super boring. Here we’re focussing on the average number of points per Super Bowl game, giving you a sense of what the Over / Under margins have been historically.
How Many Points Are Scored in the Average Super Bowl Game?
Between Super Bowl I in 1967 and Super Bowl LVIII in 2024 at total of 2704 points have been scored, an average of 46.62 points per game. The Super Bowl winners have scored 30.05 points on average, whilst the runners-up have averaged 16.57 points.
The Total Points Scored in the Super Bowl Games

By Austin Kirk, flickr
When it comes to the Super Bowl, we’re interested in the actual game itself rather than in any of the games that come before it. We’re not interested in the play-offs, for example, whilst the NFL regular season as a whole is covered in its own article. As a result, we’re going to look at the information that we have available to us to investigate how many points tend to be scored when you combine the scores notched up by both teams across the full course of the match, before averaging them out over all Super Bowls to date.
Currently, there have been 58 Super Bowls. The good news about averages is that they are able to account for occasional variances, and there is a wide enough base of games to reduce the effect of these. If you have seen Super Bowl 65, for example, then you’ll be able to look at the average after 58 Super Bowls and decide whether the score in the most recent ones vary wildly from those that came before or whether they all fit together relatively neatly in terms of fitting in with the average of the years preceding it.
The Super Bowl as a concept was created as part of the merger between the original National Football League and the American Football League in 1966. Originally known as the AFL – NFL World Championship Game, the ‘Super Bowl’ moniker was taken on for the 1969 iteration of the competition. The first four Super Bowls, which took place between 1967 and 1970, were played before the merger. There have been various numbers of teams involved in the two sides of the NFL over the years, though only one team from each makes it to the Super Bowl.
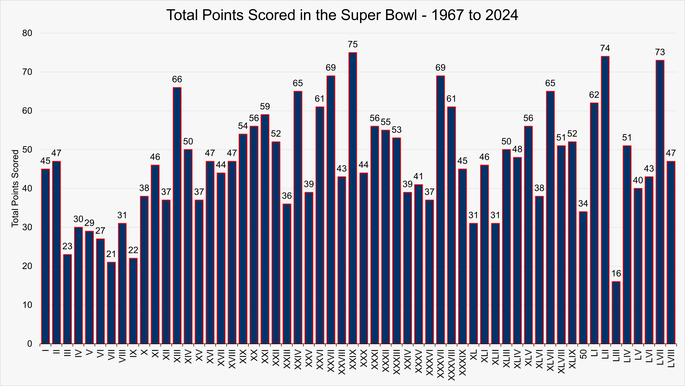
Here is a look at all of the Super Bowls that have taken place to date with the total points scored in each:

In total, 2,704 points were scored across the 58 Super Bowls that we’ve looked at. That means that the average number of points per Super Bowl is 46.62. There are obviously plenty of variants on this front, as pointed out in the article on the most and fewest points scored in Super Bowls, but if you’re considering betting on the Over/Under then that is the average number of points that have been scored across the first 58 iterations of the game.
Winning Team Average Points
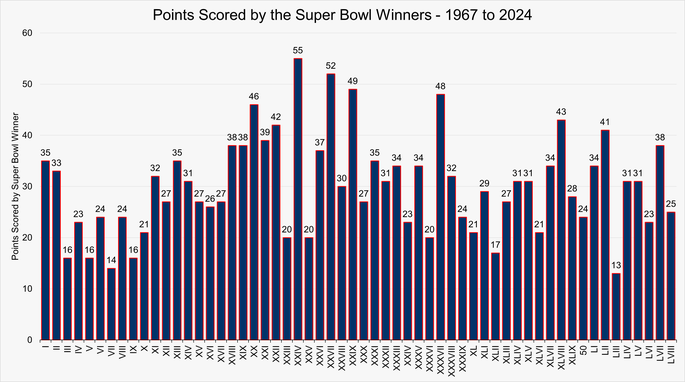
Having looked at the average number of points scored during Super Bowls, we might as well take a look at the average number of points scored by both the winning and losing teams. We will start with a look at the winning team, seeing as though the old phrase ‘to the victor go the spoils’ seems appropriate. Here are the number of points that have been racked up by the winning team across the 58 Super Bowls in question:

A total of 1,743 points were scored by teams that went on to win the Super Bowl. That gives an average of 30.05 points per winning team. Though the Super Bowl has obviously been won by teams scoring more than 30.05 points and fewer than 30.05 points at various times over the years, the reality is that a team is likely to win if they can get above the 30 points mark. Indeed, in the entire history of the Super Bowl to date, there have only been four occasions in which a team has scored 30 points and been on the losing side.
Losing Team Average Points
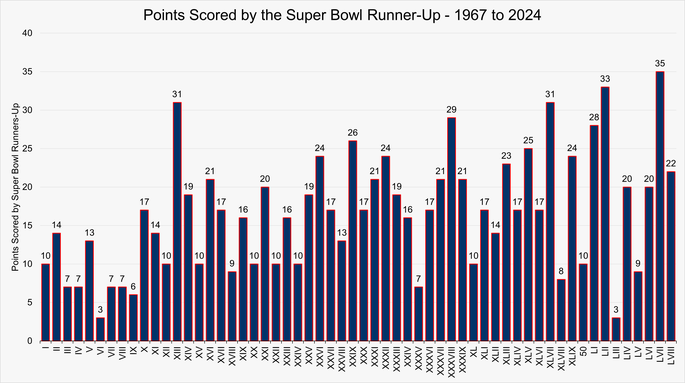
With that in mind, what sort of average points total has been racked up by the losing side? Looking at the same 58 Super Bowls, here are the number of points scored by the losing teams:

Over the 58 Super Bowls that we’ve been investigating, the total number of points scored by the losing teams is 961. That gives us an average of 16.57 points scored by losing teams in Super Bowl history. Obviously some teams have scored fewer points and lost, whilst others have scored more and still lost, but on average the team that is going to go on to lose is looking at scoring about 16/17 points. Across the 58 Super Bowls that we’ve investigated, just five teams have scored 16 points or fewer and won the game, with one team scoring 17 and winning.
In other words, the winning team has scored more than 16 points 91.38% of the time. If your team crosses the 16 point barrier, they’ve at least got a chance of success. Fail to do so, however, and they’re destined to lose, having done so 84.38% of the time in the past.
Full List of Super Bowl Scores
Below we have a table with the full list of Super Bowls with the total points, the two teams and the final scores between Super Bowl I in 1967 and Super Bowl LVIII in 2024.
Super Bowl Results – 1967 to 2024
| Super Bowl | Winning Team | Losing Team | Score | Total Points |
|---|---|---|---|---|
| I | Green Bay Packers | Kansas City Chiefs | 35 – 10 | 45 |
| II | Green Bay Packers | Oakland Raiders | 33 – 14 | 47 |
| III | New York Jets | Baltimore Colts | 16 – 7 | 23 |
| IV | Kansas City Chiefs | Minnesota Vikings | 23 – 7 | 30 |
| V | Baltimore Colts | Dallas Cowboys | 16 – 13 | 29 |
| VI | Dallas Cowboys | Miami Dolphins | 24 – 3 | 27 |
| VII | Miami Dolphins | Washington Redskins | 14 – 7 | 21 |
| VIII | Miami Dolphins | Minnesota Vikings | 24 – 7 | 31 |
| IX | Pittsburgh Steelers | Minnesota Vikings | 16 – 6 | 22 |
| X | Pittsburgh Steelers | Dallas Cowboys | 21 – 17 | 38 |
| XI | Oakland Raiders | Minnesota Vikings | 32 – 14 | 46 |
| XII | Dallas Cowboys | Denver Broncos | 27 – 10 | 37 |
| XIII | Pittsburgh Steelers | Dallas Cowboys | 35 – 31 | 66 |
| XIV | Pittsburgh Steelers | Los Angeles Rams | 31 – 19 | 50 |
| XV | Oakland Raiders | Philadelphia Eagles | 27 – 10 | 37 |
| XVI | San Francisco 49ers | Cincinnati Bengals | 26 – 21 | 47 |
| XVII | Washington Redskins | Miami Dolphins | 27 – 17 | 44 |
| XVIII | Los Angeles Raiders | Washington Redskins | 38 – 9 | 47 |
| XIX | San Francisco 49ers | Miami Dolphins | 38 – 16 | 54 |
| XX | Chicago Bears | New England Patriots | 46 – 10 | 56 |
| XXI | New York Giants | Denver Broncos | 39 – 20 | 59 |
| XXII | Washington Redskins | Denver Broncos | 42 – 10 | 52 |
| XXIII | San Francisco 49ers | Cincinnati Bengals | 20 – 16 | 36 |
| XXIV | San Francisco 49ers | Denver Broncos | 55 – 10 | 65 |
| XXV | New York Giants | Buffalo Bills | 20 – 19 | 39 |
| XXVI | Washington Redskins | Buffalo Bills | 37 – 24 | 61 |
| XXVII | Dallas Cowboys | Buffalo Bills | 52 – 17 | 69 |
| XXVIII | Dallas Cowboys | Buffalo Bills | 30 – 13 | 43 |
| XXIX | San Francisco 49ers | San Diego Chargers | 49 – 26 | 75 |
| XXX | Dallas Cowboys | Pittsburgh Steelers | 27 – 17 | 44 |
| XXXI | Green Bay Packers | New England Patriots | 35 – 21 | 56 |
| XXXII | Denver Broncos | Green Bay Packers | 31 – 24 | 55 |
| XXXIII | Denver Broncos | Atlanta Falcons | 34 – 19 | 53 |
| XXIV | St. Louis Rams | Tennessee Titans | 23 – 16 | 39 |
| XXXV | Baltimore Ravens | New York Giants | 34 – 7 | 41 |
| XXXVI | New England Patriots | St. Louis Rams | 20 – 17 | 37 |
| XXXVII | Tampa Bay Buccaneers | Oakland Raiders | 48 – 21 | 69 |
| XXXVIII | New England Patriots | Carolina Panthers | 32 – 29 | 61 |
| XXXIX | New England Patriots | Philadelphia Eagles | 24 – 21 | 45 |
| XL | Pittsburgh Steelers | Seattle Seahawks | 21 – 10 | 31 |
| XLI | Indianapolis Colts | Chicago Bears | 29 – 17 | 46 |
| XLII | New York Giants | New England Patriots | 17 – 14 | 31 |
| XLIII | Pittsburgh Steelers | Arizona Cardinals | 27 – 23 | 50 |
| XLIV | New Orleans Saints | Indianapolis Colts | 31 – 17 | 48 |
| XLV | Green Bay Packers | Pittsburgh Steelers | 31 – 25 | 56 |
| XLVI | New York Giants | New England Patriots | 21 – 17 | 38 |
| XLVII | Baltimore Ravens | San Francisco 49ers | 34 – 31 | 65 |
| XLVIII | Seattle Seahawks | Denver Broncos | 43 – 8 | 51 |
| XLIX | New England Patriots | Seattle Seahawks | 28 – 24 | 52 |
| 50 | Denver Broncos | Carolina Panthers | 24 – 10 | 34 |
| LI | New England Patriots | Atlanta Falcons | 34 – 28 | 62 |
| LII | Philadelphia Eagles | New England Patriots | 41 – 33 | 74 |
| LIII | New England Patriots | Los Angeles Rams | 13 – 3 | 16 |
| LIV | Kansas City Chiefs | San Francisco 49ers | 31 – 20 | 51 |
| LV | Tampa Bay Buccaneers | Kansas City Chiefs | 31 – 9 | 40 |
| LVI | Los Angeles Rams | Cincinnati Bengals | 23 – 20 | 43 |
| LVII | Kansas City Chiefs | Philadelphia Eagles | 38 – 35 | 73 |
| LVIII | Kansas City Chiefs | San Francisco 49ers | 25 – 22 | 47 |
