
By Daniel, flickr
In the National Football League (NFL), every point can count. Elsewhere on this site you can read about the most points and the fewest points scored by teams in the Super Bowl, including those that ended up with just 16 points scored across the four quarters of the game. Thankfully, no Super Bowl has yet ended with single digits in the points column, but when there are as many games played as there are across an NFL season you’re bound to have some games that are absolute stinkers. The good news is, that isn’t the usual scenario.
Those considering betting on something like the over/under points markets might be interested to know what sort of figures they should be thinking about when placing bets on NFL matches. Whilst the fewest points scored in a Super Bowl at the time of writing was 16, there have also been three Super Bowls that have ended with more than 70 points scored in total. Where does the regular season fit in with that sort of discussion? Do games tend to offer more excitement or less, and what factors do you need to consider?
How Many Points Are Scored in the Average NFL Game?
In the nine regular NFL seasons between 2015 and 2023, the average number of points scored per game was 45.53. During these seasons, NFC games have outscored those in the AFC by 46.18 points to 44.88.
In this time, the Kansas City Chiefs have scored the most points per game with 27.52, whilst the fewest points on average have been scored by the New York Jets with 18.27.
The Average Points Across Seven Seasons (2015 – 2023)

By Andrew nyr, flickr
Those that love the NFL as a sport will know that there are two divisions: the American Football Conference (AFC) and the National Football Conference (NFC). They will also know that points can be scored in numerous different ways, with touchdowns being the biggest points-getter for teams plying their trade in America’s most popular sport. As you’d imagine, though, how many points are scored by teams on average across an NFL season will differ per team, as well as by whether you’re looking at the AFC or the NFC.
What we’re looking at here first is the specific information about the average number of points scored in NFL matches across a season. In other words, we’re not looking at the individual teams and their point-scoring exploits, other than to learn how that plays in to a season as a whole. The regular season in the NFL involves each team playing 17 times nowadays. What we’re considering is the total number of points in a game, meaning that we will add the points scored by the home team to the number of points scored by the away side in each match.
We could, of course, look at one particular season and work out the average points per game scored during that year, but the reality is that that would give us a potentially false impression of what to expect. As a result, the best thing that we can do is to have a look at the average points per game across recent seasons to see whether there is anything trends that stand out. Do some seasons have more points scored than others, for example? Are there any major outliers? Here’s a look at nine seasons from 2015 (2015/16) to 2023 (2023/24) to gives us an idea:
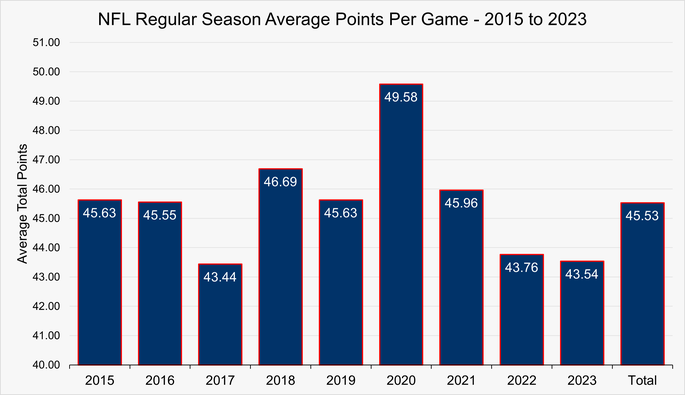
It is fair to say that there is one major outlier across the nine seasons in total, 2020. At 49.58 points per game, contests were considerably higher scoring than those seasons before and after. What does that do for the overall average across the nine seasons? The average number points in a game stands at just over 45.5. In other words, if you’re choosing to watch an NFL game then the likelihood is that you can expect to see about 46 points scored by the two teams involved. Obviously some games will be more exciting and see more than that scored, whilst others will be less interesting and will see fewer points notched up.
The lowest number of points scored between 2015 and 2023 on average came in the 2017 season, with just 43.44. Interestingly, the Super Bowl game that concluded that season had a total of 74 points scored when the Philadelphia Eagles triumphed over New England Patriots by 41-33 making it the second highest scoring Super Bowl ever.
Though each team plays 17 times nowadays, they played 16 games apiece in the regular season between 2015 and 2020. Though that doesn’t change a huge amount in terms of the average points per game, it is at least worth bearing in mind when evaluating the information.
Why The Outliers?

By Tony Webster, flickr
The obvious question that bettors will want to ask themselves is where there were such obvious outlier in terms of the average number of points scored in the NFL in 2020. Many feel that this was a direct result of the worldwide crisis, which saw a limited pre-season being played as well as numerous games having to take place behind-closed-doors. Was the lack of crowd a big factor? In order to get close to the same average points per season scored in the sport, you need to go as far back as 1948.
There is no obvious answer about why the 2017 season had such a relatively low average. Regardless, the entire history of the sport of American football leads us to believe that ‘about 40 points’ is what you can expect to see scored during an NFL team, if you take both teams’ points together. Over the seven seasons we’re looking at, that was higher at exactly 46 points.
There is a sense from some that we are currently in an ‘offensive era’, with attacking sides dominating proceedings. Even so, in 2022 there was an argument espoused in some quarters that scoring was down, as if the defence was making a comeback. A $100 bet on each game made on the Under would’ve seen people up by $1,199.50, which was far and away better than the $663.20 you’d have got at best over the previous two decades. Whether that is something you can count on moving forwards is, of course, anybody’s guess.
Comparing the AFC & NFC
The NFL is split into two, the American Football Conference (AFC) and the National Football Conference (NFC) both which include 16 teams. They are as follows:
AFC and NFC Teams
| AFC | NFC |
|---|---|
| Baltimore Ravens | Arizona Cardinals |
| Buffalo Bills | Atlanta Falcons |
| Cincinnati Bengals | Carolina Panthers |
| Cleveland Browns | Chicago Bears |
| Denver Broncos | Dallas Cowboys |
| Houston Texans | Detroit Lions |
| Indianapolis Colts | Green Bay Packers |
| Jacksonville Jaguars | Los Angeles Rams |
| Kansas City Chiefs | Minnesota Vikings |
| Las Vegas Raiders | New Orleans Saints |
| Los Angeles Chargers | New York Giants |
| Miami Dolphins | Philadelphia Eagles |
| New England Patriots | San Francisco 49ers |
| New York Jets | Seattle Seahawks |
| Pittsburgh Steelers | Tampa Bay Buccaneers |
| Tennessee Titans | Washington Commanders |
Team/Franchise Team Name Changes
The Las Vegas Raiders were originally the Oakland Raiders, moving to Los Angeles between 1982 and 1994 before a return to Oakland. They made the switch to Las Vegas in 2020, changing names once more. The Los Angeles Chargers were the San Diego Chargers from 1961 until 2017.
The Washington Commanders were known as the Washington Redskins for most of the club’s existence before it was accepted that this was a deeply offensive name. The team briefly became the Washington Football Team before it was re-branded as the Washington Commanders in 2022.
The Los Angeles Rams were founded in 1936 as the Cleveland Rams. The team moved to Los Angeles in 1946 then moved to St. Louis to become the St. Louis Rams in 1994. They moved back to L.A. in 2016, becoming the Los Angeles Rams once more.
Average Points Scored in Each Conference
The nature of the NFL is such that you need to look at the two sides of the organisations, the AFC and the NFC, in order to get an overall sense of what happens during a league season. Therefore, it is interesting in asking the question about the average number of points per game scored across those same nine seasons for each conference. Here’s how it pans out:
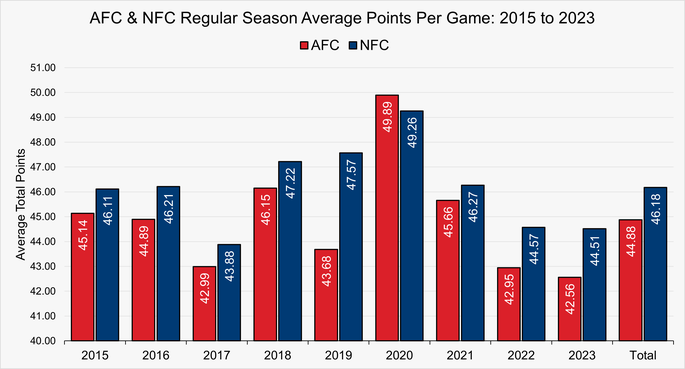
Across the nine seasons in the AFC, the average points per game stood at 44.88 compared to 46.18 scored in NFC games. During the period that we are looking at, NFC games outscored those in the AFC in every regular season with the exception of 2020.
For that reason, the 2020 season again stands out as being different to other seasons. That, of course, ties in with the information that we have from that season in general, in terms of the campaign that offered an average number of points per game that differed wildly from the rest of the seasons that we were looking at.
We can see that for most seasons, the differences between the two conferences is around just one points, to that extent scoring is broadly similar in both conferences. The standout season in this respect is 2019, when the NFC outscored the AFC by almost four points on average, this despite the AFC having the highest scoring team in the regular season in the Baltimore Ravens.
Do Some Teams Perform Better Than Others?

By Conman33, Wikimedia Commons
Now that we’ve established what the average points per game is across both halves of the NFL and broken it down by season, it is worth considering whether there are some teams that perform better than others. Given the fact that some teams, such as the New England Patriots, tend to appear in Super Bowls on a more regular basis than others, it isn’t an outrageous suggestion. Here is a look at the information from all teams across the nine seasons in question:
NFL Regular Season Points Scored by Team – 2015 to 2023
| Team | Conference | Games | Points | PPG |
|---|---|---|---|---|
| Kansas City Chiefs | AFC | 147 | 4045 | 27.52 |
| New Orleans Saints | NFC | 147 | 3865 | 26.29 |
| Dallas Cowboys | NFC | 147 | 3724 | 25.33 |
| Baltimore Ravens | AFC | 147 | 3674 | 24.99 |
| Philadelphia Eagles | NFC | 147 | 3641 | 24.77 |
| New England Patriots | AFC | 147 | 3608 | 24.54 |
| Seattle Seahawks | NFC | 147 | 3601 | 24.50 |
| Green Bay Packers | NFC | 147 | 3584 | 24.38 |
| Buffalo Bills | AFC | 146 | 3553 | 24.34 |
| Tampa Bay Buccaneers | NFC | 147 | 3549 | 24.14 |
| Minnesota Vikings | NFC | 147 | 3464 | 23.56 |
| Los Angeles Rams | NFC | 147 | 3446 | 23.44 |
| Los Angeles Chargers | AFC | 147 | 3445 | 23.44 |
| San Francisco 49ers | NFC | 147 | 3443 | 23.42 |
| Atlanta Falcons | NFC | 147 | 3422 | 23.28 |
| Detroit Lions | NFC | 147 | 3395 | 23.10 |
| Indianapolis Colts | AFC | 147 | 3388 | 23.05 |
| Arizona Cardinals | NFC | 147 | 3317 | 22.56 |
| Pittsburgh Steelers | AFC | 147 | 3316 | 22.56 |
| Tennessee Titans | AFC | 147 | 3239 | 22.03 |
| Cincinnati Bengals | AFC | 146 | 3236 | 22.16 |
| Miami Dolphins | AFC | 147 | 3217 | 21.88 |
| Las Vegas Raiders | AFC | 147 | 3214 | 21.86 |
| Carolina Panthers | NFC | 147 | 3185 | 21.67 |
| Houston Texans | AFC | 147 | 3066 | 20.86 |
| Jacksonville Jaguars | AFC | 147 | 2996 | 20.38 |
| Washington Commanders | NFC | 147 | 2993 | 20.36 |
| Cleveland Browns | AFC | 147 | 2984 | 20.30 |
| Chicago Bears | NFC | 147 | 2948 | 20.05 |
| Denver Broncos | AFC | 147 | 2890 | 19.66 |
| New York Giants | NFC | 147 | 2855 | 19.42 |
| New York Jets | AFC | 147 | 2686 | 18.27 |
Here we can see that the NFL’s top regular season scorers are the Kansas City Chiefs between 2015 and 2023 with 27.52 points per game. The New Orleans Saints are second on our list with 26.29, and the Dallas Cowboys in third with 25.33 points per game.
At the bottom of the scorers list between 2015 and 2023 are the New York Jets who averaged just 18.27 points per game. They are followed by the New York Giants with 19.42 points and the Denver Broncos with 19.66 points per game.
We know that in recent seasons, NFC games have generally outscored the AFC games. We can see further evidence of this in the table above. Although the highest scorers in the NFL are the AFC’s Chiefs, eleven out of the top sixteen scoring teams are from the NFC.
It was the Kansas City Chiefs who have had the highest scoring regular season in the period analysed, with 565 points in their 16 games in 2018, 35.31 points per game. The fewest points in a single regular season between 2015 and 2023 was the 224 recorded by the Los Angeles Rams in 2016, this averaged at 14 points per game. This was the season following the Rams’ relocation from St. Louis to LA.
Do The Highest Scorers Win The Super Bowl?
One points that both bettors and sports fans alike will be interested to learn is whether or not a high points per game average from a team during the regular season correlates in any real way with Super Bowl success. Here is a look at the teams with the highest points per game average across each of the nine seasons that we’re looking at, as well as the winners and runners-up in that season’s Super Bowl:
Highest Scoring Teams – 2015 to 2023
| Season | Highest PPG Average | Super Bowl Winner | Super Bowl Runner-Up |
|---|---|---|---|
| 2023 | Dallas Cowboys | Kansas City Chiefs | San Francisco 49ers |
| 2022 | Kansas City Chiefs | Kansas City Chiefs | Philadelphia Eagles |
| 2021 | Dallas Cowboys | Los Angeles Rams | Cincinnati Bengals |
| 2020 | Green Bay Packers | Tampa Bay Buccaneers | Kansas City Chiefs |
| 2019 | Baltimore Ravens | Kansas City Chiefs | San Francisco 49ers |
| 2018 | Kansas City Chiefs | New England Patriots | Los Angeles Rams |
| 2017 | Los Angeles Rams | Philadelphia Eagles | New England Patriots |
| 2016 | Atlanta Falcons | New England Patriots | Atlanta Falcons |
| 2015 | Carolina Panthers | Denver Broncos | Carolina Panthers |
Interestingly, the highest scoring team for points per game on average across our nine seasons only went on to win the Super Bowl once. That team was the Kansas City Chiefs, who were the highest scorers in the 2022 season, winning Super Bowl LVII in February of 2023. On two more occasions did a highest scoring team reach the Super Bowl only to lose the big game in this period, they were the Carolina Panthers in 2015/16 and the Atlanta Falcons in 2016/17.