 The Grand National is one of the most watched horse races in the world, with around 600 million people tuning in to see the ‘World’s Greatest Steeplechase’ play out. As a result, there is a huge amount of interest in the event, especially when it comes to those who quite like a flutter every now and then. Elsewhere on this site you can read about the number of fallers that tend to strike when the main event at Aintree takes place, with this page looking more specifically at the average number of finishers of the race. In other words, how many horses get to the end?
It might seem like a strange question, but the Grand National is a race that is famed for the difficulty of its fences. With a field of 40 horses often taking to the turf, each jump offers its own challenge. We have explored whether more horses fall during the first circuit or the second, but this is less about how many fall and more about how many are able to cope with the challenge of the circuit and keep going to the end. After all, there are more reasons than just falling at a fence for why a horse might not finish the race, so knowing how many are likely to may help with your betting.
Quick Answer: How Many Horses Finish the Grand National?
Between 1984 and 2023, when the field size was limited to a maximum of 40 runners, 580 horses out of 1476 runners finished the Grand National, 39.3%. This averages out at around 15 finishers per race.
In 1996, 63.0% of the runners in the Grand National finished the race, the highest percentage since 1984. The lowest was 10% in 2001, when just four horses finished.
Why It Matters

You might well wonder why, exactly, the number of horses that make it to the end of the Grand National actually matters. The answer is that it is helpful to get a sense of what the chances are of your horse even making it to the end of the event. If you know that roughly 60% of horses fail to even make it to the end, that helps you to figure out whether a bet on a long-shot horse is even worth placing. If a horse is being given odds of 150/1 by the bookmakers and you know that half of all of horses won’t make it to the finish line, it is probably likely that your selection isn’t going to be in the half that makes it.
Of course, this also means that each-way bets become more worthwhile. Although your horse has long odds, the chances of it making it into the places are vastly improved if 60% of the horses fail to make it to the end. Although there’s a good chance that your selection won’t be making it all the way, if it does make it there then the chances of it being paid out by bookies that offer extended places on the National increase. It isn’t a fool-proof way of thinking, but it is at least worth bearing in mind when it comes to selecting the type of bet you want to place.
Looking At The Stats
Now that we know what we’re looking at and why we’re doing it, it is worth exploring what the actual stats say about the Grand National and the number of horses that finish the race. We are not looking at why a horse doesn’t make it to the end, just how many manage it and what that means about the sorts of bets that we can consider placing. We will take a look at the races between 1984 and 2023, ensuring that we have a sold base of stats with which to try to draw some conclusions about the Grand National and what it all means.
Grand National Finishers by Year – 1984 to 2023
| Year | Starters | Finishers (%) |
|---|---|---|
| 1984 | 40 | 23 (57.5%) |
| 1985 | 40 | 11 (27.5%) |
| 1986 | 40 | 17 (42.5%) |
| 1987 | 40 | 22 (55.0%) |
| 1988 | 40 | 9 (22.5) |
| 1989 | 40 | 14 (35.0) |
| 1990 | 38 | 20 (52.6%) |
| 1991 | 40 | 17 (42.5%) |
| 1992 | 40 | 22 (55.0%) |
| 1994 | 36 | 6 (16.7%) |
| 1995 | 35 | 15 (42.9%) |
| 1996 | 27 | 17 (63.0%) |
| 1997 | 36 | 17 (46.0%) |
| 1998 | 37 | 6 (16.2%) |
| 1999 | 32 | 18 (56.3%) |
| 2000 | 40 | 17 (42.5%) |
| 2001 | 40 | 4 (10.0%) |
| 2002 | 40 | 11 (27.5%) |
| 2003 | 40 | 14 (35.0%) |
| 2004 | 39 | 11 (28.2%) |
| 2005 | 40 | 21 (52.5%) |
| 2006 | 40 | 9 (22.5%) |
| 2007 | 40 | 12 (30.0%) |
| 2008 | 40 | 15 (37.5%) |
| 2009 | 40 | 17 (42.5%) |
| 2010 | 40 | 14 (35.0%) |
| 2011 | 40 | 19 (47.5%) |
| 2012 | 40 | 15 (37.5%) |
| 2013 | 40 | 17 (42.5%) |
| 2014 | 40 | 18 (45.0%) |
| 2015 | 39 | 19 (47.5%) |
| 2016 | 39 | 16 (40.0%) |
| 2017 | 40 | 19 (47.5%) |
| 2018 | 38 | 12 (31.6%) |
| 2019 | 40 | 19 (47.5%) |
| 2021 | 40 | 15 (37.5%) |
| 2022 | 40 | 15 (37.5%) |
| 2023 | 40 | 17 (42.5%) |
Across the 38 years of Grand Nationals that we’re looking at, a total of 1,476 horses ran in the event. That is an average of 38.9 per race.
In terms of the horses that finished the race, there were 580 horses over the 38 years in question. That works out as an average of 15.3 that managed to finish the race.
Over the period of time that we’re looking at, 39.3% of the horses managed to get to the end of the race without falling, pulled-up, unseating their jockey, refusing to jump the fence or for any other reason.
We can also rank each race from the highest percentage of finishers to the lowest, as shown in the chart below.
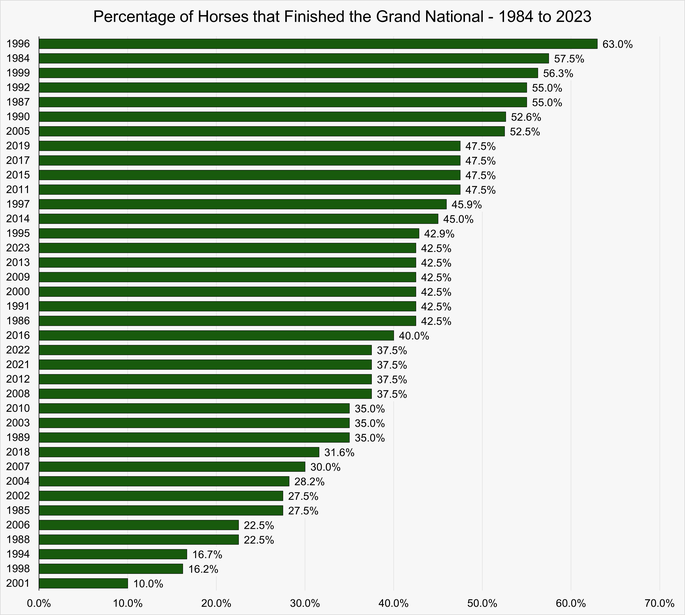
This tells us that the highest percentage of finishers was in 1996 when 63% of runners completed the race. At the other end of the spectrum, just four horses (10%) crossed the line in 2001 the lowest percentage of finishers since 1984.
Looking At Specific Races
Now that we know the average number of horses that managed to complete the race across the 38 years that we’ve decided to concentrate on, it is worth having a look at a few years in particular to see if there’s anything that we can learn from them in terms of the finishers.
1984 Grand National Finishers
| Position | Horse | Age | Weight | Odds |
|---|---|---|---|---|
| 1 | Hallo Dandy | 10 | 10-2 | 13/1 |
| 2 | Greasepaint | 9 | 11-2 | 9/1 |
| 3 | Corbiere | 9 | 12-0 | 16/1 |
| 4 | Lucky Vane | 9 | 10-13 | 12/1 |
| 5 | Earthstopper | 10 | 11-1 | 33/1 |
| 6 | Two Swallows | 11 | 10-0 | 28/1 |
| 7 | Fethard Friend | 9 | 10-12 | 22/1 |
| 8 | Broomy Bank | 9 | 10-12 | 12/1 |
| 9 | Jivago De Neuvy | 9 | 11-0 | 50/1 |
| 10 | Grittar | 11 | 11-10 | 12/1 |
| 11 | Hill Of Slane | 8 | 10-2 | 33/1 |
| 12 | Tacroy | 10 | 10-7 | 28/1 |
| 13 | Doubleuagain | 10 | 10-5 | 100/1 |
| 14 | Beech King | 10 | 10-1 | 66/1 |
| 15 | Eliogarty | 9 | 11-5 | 16/1 |
| 16 | Spartan Missile | 12 | 11-4 | 18/1 |
| 17 | Yer Man | 9 | 10-2 | 25/1 |
| 18 | Fauloon | 9 | 10-13 | 50/1 |
| 19 | Another Captain | 12 | 10-1 | 66/1 |
| 20 | Mid Day Gun | 10 | 10-3 | 40/1 |
| 21 | Poyntz Pass | 9 | 10-5 | 100/1 |
| 22 | Jacko | 12 | 10-4 | 66/1 |
| 23 | Canford Ginger | 9 | 10-1 | 100/1 |
Interestingly, the first year that we chose to look at, 1984, saw the most finishers to date. The reason we chose 1984 wasn’t arbitrary, but was instead because that was the first year in which the field was limited to a maximum of 40 runners. There had been 41 runners the years before, with the reduced field likely leading to the increased number of finishers that has yet to be matched or beaten in the years that followed. The 57.5% of finishers is significantly higher than the average number across the 38 years that we’re looking at, but it isn’t the highest.
1996 Grand National Finishers
| Position | Horse | Age | Weight | Odds |
|---|---|---|---|---|
| 1 | Rough Quest | 10 | 10-7 | 7/1 |
| 2 | Encore Un Peu | 9 | 10-0 | 14/1 |
| 3 | Superior Finish | 10 | 10-3 | 9/1 |
| 4 | Sir Peter Lely | 9 | 10-0 | 33/1 |
| 5 | Young Hustler | 9 | 11-7 | 8/1 |
| 6 | Three Brownies | 9 | 10-0 | 100/1 |
| 7 | Life Of A Lord | 10 | 11-6 | 10/1 |
| 8 | Antonin | 8 | 10-0 | 28/1 |
| 9 | Over The Deel | 10 | 10-0 | 33/1 |
| 10 | Vicompt De Valmont | 11 | 10-1 | 22/1 |
| 11 | Captain Dibble | 11 | 10-0 | 40/1 |
| 12 | Riverside Boy | 13 | 10-0 | 66/1 |
| 13 | Over The Stream | 10 | 10-0 | 50/1 |
| 14 | Greenhill Raffles | 10 | 10-0 | 100/1 |
| 15 | Into The Red | 12 | 10-0 | 33/1 |
| 16 | Lusty Light | 10 | 10-11 | 14/1 |
| 17 | Sure Metal | 13 | 10-1 | 200/1 |
In terms of percentages, the highest number of horses that finished the race stands at 63.0%. It is not a coincidence that the highest number of finishers happened in the race with the fewest participants, with 27 horses starting. This was in spite of the fact that the maximum field of 40 horses was allowed. In other words, if the organisers of the Grand National wanted to offer the best possible chance of horses finishing the race then the key thing that they could do would be to limit the field to around 25 horses. No race since has had as few starters or so many finishers.
2001 Grand National Finishers
| Position | Horse | Age | Weight | Odds |
|---|---|---|---|---|
| 1 | Red Marauder | 11 | 10-11 | 33/1 |
| 2 | Smarty | 8 | 10-0 | 16/1 |
| 3 | Blowing Wind | 8 | 10-9 | 16/1 |
| 4 | Papillon | 10 | 11-5 | 14/1 |
In 2001, the maximum field of 40 horses started the race. Remarkably, only four of them finished it. That was just 10% of the field, which is easily the lowest amount that got to the end of the race over the 38 years that we’re looking at. Even then only two of the horses completed the race without any mishap, with two others having to be re-mounted before they could reach the finish line. Interestingly, most other meetings were cancelled in the build-up to the National, including the Cheltenham Festival, due to the outbreak of foot-and-mouth disease in the country.
Whilst it is obviously impossible to know for sure, it is possible that the lack of practice for horses is part of what caused the issues for the participants. There was also adverse weather, meaning that the going was heavy and high winds made life very difficult for the jockeys. There were a high number of falls during the race, including eight at the first jumping of the Canal Turn. Many felt that the conditions were too wet and muddy, but supporters of the race were quick to point out that no injuries were sustained to any of the horses or the riders.
Things To Consider When Betting

Whilst we can obviously have a conversation about what Aintree Racecourse and the Jockey Club should or should not be doing regarding the safety of the horses, what we’re most interested in here is what this data means when you’re thinking about placing bets. A big part of the appeal of the Grand National is the sense that any of the horses taking part can win it. From the moment that Tipperary Tim became the first horse to win it with odds of 100/1 in 1928, the National has been seen as an event in which the top prize is up for grabs right until the last minute.
As a result, a lot of people will often place a bet on a short-odds horse, another bet on a medium-odds horse and a final bet on an outsider. What we know from our data is that, on average, only 39.3% of the horses that start the race are likely to make it to the end. Over fives years from 2018 to 2023, the longest odds horse to finish in the top six was 100/1, achieved by Balko Des Flos’ second place finish in 2021. Other notable finishes include 50/1 Born By The Sea coming sixth in 2023, Noble Yeats winning with those odds in 2022 and Magic of Light coming second at 66/1 in 2019.
In other words, the fact that just shy of 40% of horses finish the race on average each year doesn’t mean that you should automatically discount a bet on a horse with longs odds, presuming that you’re opting for either an each-way or a place wager. Across the course of the National’s history, only five horses have won with odds of 100/1 and the most recent was in 2009. After Noble Yeats, the next long-odds winner was Auroras Encore’s 66/1 victory in 2013. Less than half of all of the horses that take part in the Grand National finish it, so horses with long odds have a better chance than you might think.