 There are many reasons why the Premier League is considered to be one of the greatest leagues in the world. It is one of the richest, so it tends to pay the most money and attract some of the top players from countries such as Spain, Germany and Egypt. It is home to some of the best-known teams on the planet, such as Liverpool and Manchester United. Mostly, though, it is a league that is all about the attacking play, with goals scored virtually every single time a team takes to the field. In fact, there are far more games with goals than there are games without any.
Since the competition began in 1992, there have been some seasons in which it has felt like there have been goals scored every time a player has touched the ball. Other times, though, it has seemed as though the defences have got on top of the attackers, keeping them out and keeping the goals total as low as possible. It is also important to remember that some seasons have had more teams playing in the top-flight than others, so there were more matches played and more goals scored as a consequence. Here is a look at which Premier League season has had the most goals.
Quick Answer: What Was the Highest Scoring Premier League Season?
The 2022-23 Premier League season had 1084 goals scored in 380 matches, averaging a record 2.85 goals per game.
The highest number of total goals scored in a season was during the first Premier League campaign in 1992-93 when 1,222 goals were scored. With 22 teams and 462 matches played, however, the average number of goals per game was 2.65.
Looking At The Numbers
First things first, let’s have a look at the actual numbers. Here we will look at each season since the first one in the Premier League in 1992-1993. We will tell you how many goals were scored, how many games were played and what the average number of goals per game was for the campaign in question, which helps with the problem of some seasons having more games than others:
Premier League Goals by Season – 1992-93 to 2022-23
| Season | Goals | Games | Goals Per Game |
|---|---|---|---|
| 2022-2023 | 1,084 | 380 | 2.85 |
| 2021-2022 | 1,071 | 380 | 2.82 |
| 2020-2021 | 1,024 | 380 | 2.69 |
| 2019-2020 | 1,034 | 380 | 2.72 |
| 2018-2019 | 1,072 | 380 | 2.82 |
| 2017-2018 | 1,018 | 380 | 2.68 |
| 2016-2017 | 1,064 | 380 | 2.80 |
| 2015-2016 | 1,026 | 380 | 2.70 |
| 2014-2015 | 975 | 380 | 2.57 |
| 2013-2014 | 1,052 | 380 | 2.77 |
| 2012-2013 | 1,063 | 380 | 2.80 |
| 2011-2012 | 1,066 | 380 | 2.81 |
| 2010-2011 | 1,063 | 380 | 2.80 |
| 2009-2010 | 1,053 | 380 | 2.77 |
| 2008-2009 | 942 | 380 | 2.48 |
| 2007-2008 | 1,002 | 380 | 2.64 |
| 2006-2007 | 931 | 380 | 2.45 |
| 2005-2006 | 944 | 380 | 2.48 |
| 2004-2005 | 975 | 380 | 2.57 |
| 2003-2004 | 1,012 | 380 | 2.66 |
| 2002-2003 | 1,000 | 380 | 2.63 |
| 2001-2002 | 1,001 | 380 | 2.63 |
| 2000-2001 | 992 | 380 | 2.61 |
| 1999-2000 | 1,060 | 380 | 2.79 |
| 1998-1999 | 959 | 380 | 2.52 |
| 1997-1998 | 1,019 | 380 | 2.68 |
| 1996-1997 | 970 | 380 | 2.55 |
| 1995-1996 | 988 | 380 | 2.60 |
| 1994-1995 | 1,195 | 462 | 2.59 |
| 1993-1994 | 1,195 | 462 | 2.58 |
| 1992-1993 | 1,222 | 462 | 2.65 |
You can see that the average number of goals scored per game each season has been roughly the same irrespective of the number of games played, but that that number has increased in the more recent campaigns. In all, there have been 11,564 games played during the Premier League era, with 32,072 goals scored. That is an average of 2.77 goals per game. There have been eight seasons with more average goals per game than that, as well as another two that have had exactly that number of goals per game on average during them, meaning ten that fit into the ‘more goals than average’ bracket.
Here is a look at the seasons that featured more than 2.77 goals per game on average, as well as the two that featured exactly that many, along with the actual average goals per game scored:
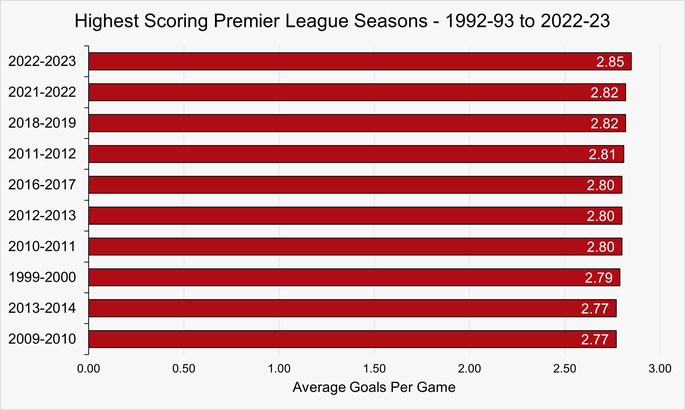
It is interesting that only one season before 2009 had an average number of goals per game that was above the 2.77 that is the overall average. It seems as if more goals are being scored in the modern era of the Premier League than in the past.
Looking At The Highest Scoring Season (1992-93)
In terms of actual goals, no season to date has seen more than the 1,222 that were scored during the 1992-1993 campaign. That, of course, was the inaugural one for the new-look Premier League, with Manchester United winning their first title under Alex Ferguson.
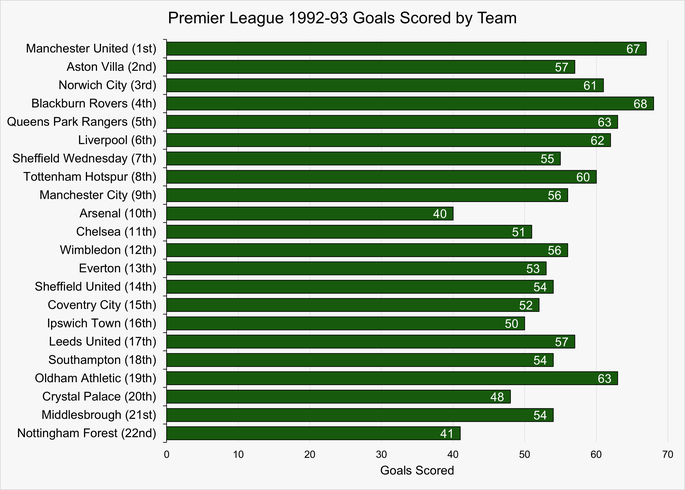
There were 22 teams in the division, which hadn’t yet been reduced to 20 teams. That happened in time for the 1995-1996 campaign, with both of the seasons between the two seeing 1,195 goals scored. They also had more goals than any of the 38-team campaigns, but we won’t look at them separately.
The longest unbeaten run during the season was the 11 games that Manchester United went without losing, whilst both United and Sheffield Wednesday won seven games in succession, which was the longest winning run. There were five games that featured eight goals, which were Oldham Athletic’s 5-3 win over Nottingham Forest, Blackburn Rovers’ 7-1 defeat of Norwich City, Oldham Athletic’s 6-2 win against Wimbledon, Everton’s 3-5 home loss to Queens Park Rangers, and Liverpool’s 6-2 defeat of Tottenham Hotspur at Anfield.
The Highest Goals Per Game Average (2022-23)
It is, of course, understandable that the seasons that featured the most games would also see more goals being scored. It is why it is helpful to look at the average number of goals per game, which shows us that the most recent season that we have looked at, the 2022-2023 campaign, is also the one with the most goals scored per game on average. There were 1,084 goals scored across 380 games, giving an average goals per game total of 2.85. Manchester City won the title, which was their seventh of the Premier League era and their ninth top-flight title.
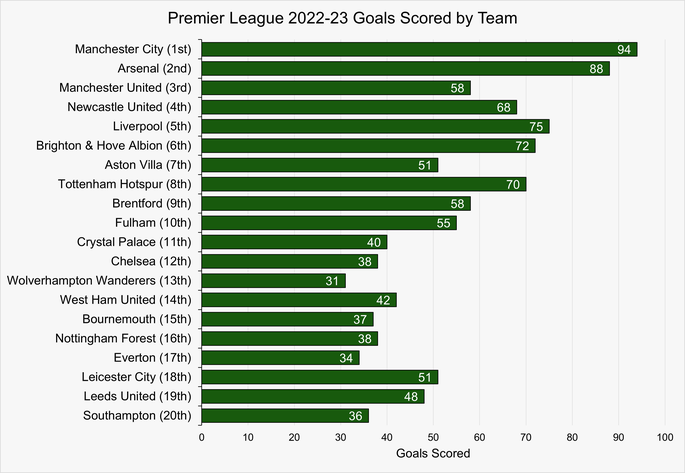
Pep Guardiola’s side won 12 matches in succession at one point during the season, which was the longest run of wins that any side put together. It was enough to claw back Arsenal’s lead at the top of the table and see them pip the Gunners to the title. Newcastle United, having been taken over by the Public Investment Fund of Saudi Arabia, went 17 games unbeaten, which was a record for the campaign.
The highest scoring games were when Liverpool defeated Bournemouth 9-0 at Anfield and when Manchester City beat their city rivals Manchester United 6-3 at the Etihad. Liverpool were involved in both the highest scoring home win, which was that 9-0 defeat of Bournemouth, and the highest scoring away win. The latter came when they defeated Leeds United 6-1 at Elland Road. Bizarrely, though, the Merseyside team struggled in the Premier League in spite of scoring big in a number of games, also beating Manchester United 7-0, finishing fifth and missing out on Champions League football.