 Those that love the game tend to think of football matches are being events that are filled with exciting moments. Whilst a brilliant tackle can certainly get the blood pumping and a top save will elicit appreciation of a goalkeeper’s dexterity, we don’t tend to remember them in the same way as the ball hitting the back of the net. American audiences abhor the idea of a draw, whereas for lovers of football a hard-fought draw can be just as memorable as an overwhelming win.
We love goals being scored, which is why 0-0 draws tend to fade from our memory pretty quickly unless it happened to be the match that saw your team survive relegation or qualify for the next round of a cup competition. When it comes to having a flutter, though, there’s something counter-intuitive about placing a bet on a match ending in a stalemate. Draws feel harder to predict, but should we dismiss them so readily from our thoughts when placing a bet?
Quick Answer: How Often Do Matches End in a Draw?
In the five seasons between 2015/16 and 2019/20 25.5% of Premier League, Championship, FA Cup and EFL Cup games ended 90 minutes in a draw. The Championship had the highest drawn match percentage with 27.6%, followed by the Premier League on 23.8, the FA Cup on 22% with the EFL Cup the lowest with 21.1% of games drawn.
League Draws (Premier League & Championship)
By Daniel, flickr
The best way to get an understanding of just how common a draw is in football is by having a look at previous seasons and seeing how often a match finished in a share of the spoils. Here we’ll look at the Premier League and the Championship in England, summarising the data from 2015-2016, 2016-2017, 2017-2018, 2018-2019 and 2019-2020.
Premier League & Championship Draws – 2015/16 to 2019/20
| Season | Premier League | Championship | Combined |
|---|---|---|---|
| 2015/16 | 107 (28.16%) | 172 (31.16%) | 279 (29.94%) |
| 2016/17 | 84 (22.11%) | 130 (23.55%) | 214 (22.96%) |
| 2017/18 | 99 (26.05%) | 148 (26.81%) | 247 (26.50%) |
| 2018/19 | 71 (18.68%) | 162 (29.35%) | 233 (25.00%) |
| 2019/20 | 92 (24.21%) | 149 (26.99%) | 241 (25.86%) |
| Total (5 Seasons) | 453 (23.84%) | 761 (27.57%) | 1214 (26.05%) |
You can see from the table, then, that draws are far more common in the Championship. That isn’t a massive shock, given the English second division contains twenty-four teams and therefore plays host to 552 matches per season compared to the Premier League’s 380.
What we can learn from looking at the percentages is that around 1 in every 4.2 Premier League matches will end in a draw, on average, as opposed to about 1 in 3.6 in the Championship. If you’re looking at the top two divisions of English football combined then it’s just under 1 in every 4 games that end in a draw.
The key thing to remember is that those stats are looking across an entire season of action. Much as a roulette wheel will present the casino with an edge of about 5% over the course of a prolonged period of time, so too will draws come into play after a length of time rather than on any given weekend. If there are ten matches taking place in a week it doesn’t mean that three or four of them will definitely be draws.
Cup Game Draws (FA Cup & EFL Cup)
By Gareth Williams, flickr
Given that leagues will always offer a point for a draw, it makes sense that teams may well decide to settle for honours even rather than either side going for the kill in the closing stages. Whilst some cups offer replays when matches are drawn, some will go straight to a penalty shoot-out if neither team is leading after ninety minutes. Regardless, managers tend not to want to have to endure a replay, so cup games are far less likely to end in draws.
Here we’ll have a look at results from the 3rd round of the FA Cup through to the final and the 2nd round of the League Cup through to the final. The match will only be considered to be a draw if that was how things were at the end of ninety minutes, removing extra-time and, of course, penalties from the equation. We’ll look at the same five seasons as we did when exploring the number of draws in the Premier League and the Championship.
FA Cup & EFL Cup Draws – 2015/16 to 2019/20
| Season | FA Cup | League Cup | Combined |
|---|---|---|---|
| 2015/16 | 19 (24.68%) | 16 (28.07%) | 35 (26.12%) |
| 2016/17 | 12 (16.22%) | 12 (20.69%) | 24 (18.18%) |
| 2017/18 | 18 (23.38%) | 9 (15.52%) | 27 (20.00%) |
| 2018/19 | 14 (19.44%) | 10 (17.24%) | 24 (18.46%) |
| 2019/20 | 20 (25.97%) | 14 (24.12%) | 34 (25.19%) |
| Total (5 Seasons) | 83 (22.02%) | 61 (21.11%) | 144 (21.62%) |
It’s worth pointing out that the FA Cup includes matches that were drawn at the first time of acting and then drawn again in the replay before being decided either after extra time or thanks to penalties. Regardless, you can see that there are more draws in the FA Cup than in the League Cup, which isn’t that surprising when you consider that the FA Cup tends to feature more matches in general.
Because of the nature of the FA Cup in particular, it is much harder to figure out the percentage of matches that end in a draw because of the sheer number of replays taking place in the competition. In the 2015-2016 campaign, for example, there were seventy-seven matches from the third round through to the final. That means that just under 25% of matches that season ended in draws leading up to the final. The following year it was seventy-four matches, so slightly above 16%.
Things are much easier to figure out in the League Cup, with fifty-seven matches between the second round and the final in the 2015-2016 campaign. There were fifty-eight matches in each of the years after, with the fact that the competition doesn’t have replays keeping the numbers consistent. The only variation is due to the number of teams playing in European competitions, dictating who enters in round 2 and 3. Regardless, it was just over 28% of games that ended in draws in 2015-2016 compared to a low of 15.5% in 2017/18.
Whilst we do see a high degree of variation in the cups, we can see that matches are less likely to be drawn on average than in the league.
How Common Are 0-0 Draws?
By Daniel, flickr
Knowing how many matches tend to end in draws in general is one thing, but the excitement in most football matches comes in the form of the ball being put into the back of the net. Betting on a goalless draw feels like a massive risk when you consider the amount of goals scored in the Premier League and Championship, yet it is also a wager that countless punters opt for because it seems like the associated payout is decent enough to warrant it.
In reality then, how many of games finish 90 minutes goalless? A 0-0 might not be the most thrilling scoreline when it comes to being the watcher, but is it a scoreline worth keep an eye out for if you’re the bettor looking for an edge? Here we’ll look back at those same seasons from the Premier League and the Championship and assess how many were goalless draws and what percentage of matches played that works out as.
Premier League & Championship 0-0 Draws
| Season | Premier League | Championship | Combined |
|---|---|---|---|
| 2015/16 | 32 (8.42%) | 57 (10.33%) | 89 (9.55%) |
| 2016/17 | 27 (7.11%) | 34 (6.16%) | 61 (6.55%) |
| 2017/18 | 32 (8.42%) | 49 (8.88%) | 81 (8.69%) |
| 2018/19 | 22 (5.79%) | 39 ( 7.07%) | 61 (6.55%) |
| 2019/20 | 21 (5.53%) | 32 (5.80%) | 53 (5.69%) |
| Total (5 Seasons) | 134 (7.05%) | 211 (7.64%) | 345 (7.40%) |
What we can see is that around 7% of matches played end 0-0 in both the Premier League and Championship. This equates to roughly 1 in every 13.5 games finishing goalless.
When looking at 0-0 draws as a percentage of all games played, in the Premier League in 2015-2016, 1 game in roughly every 12 was a goalless draw. In 2016-2017 that shifted to 1 in every 14, whilst in 2017-2018 it was back to being 1 in every 12. During the 2018-2019 campaign there was a goalless draw once in every 17 matches or so, but in the 2019-2020 campaign 1 match was goalless once every 18 games, give or take.
As for the Championship, goalless draws were in general more common. The 2015-2016 campaign saw 1 in 10 matches ending without a goal, compared to 1 in 16 the year after. 2017-2018 was a draw in every 11 games, whilst 2018-2019 saw 1 in 16 or so matches again ending goalless. In 2019-2020 there were even fewer, with just 1 in every 17 and a bit matches finishing without a goal having been scored.
Cup Goalless Draws (FA Cup & EFL Cup)
The obvious question is whether 0-0 draws are more or less likely in the FA Cup and League Cup than they are in England’s top two divisions. Again, the best thing to do is to be consistent and stick with the same five seasons, this time only looking at matches that hadn’t seen a goal within the ninety minutes of play. That means ignoring extra-time results where necessary, whilst it does include replays in the FA Cup.
FA Cup & EFL Cup 0-0 Draws – 2015/16 to 2019/20
| Season | FA Cup | League Cup | Combined |
|---|---|---|---|
| 2015/16 | 4 (5.19%) | 3 (5.26%) | 7 (5.22%) |
| 2016/17 | 7 (9.46%) | 2 (3.45%) | 9 (6.82%) |
| 2017/18 | 9 (11.69%) | 4 (6.90%) | 13 (9.63%) |
| 2018/19 | 2 (2.78%) | 3 (5.17%) | 5 (3.85%) |
| 2019/20 | 4 (5.19%) | 4 (6.90%) | 8 (5.93%) |
| Total (5 Seasons) | 26 (6.90%) | 16 (5.54%) | 42 (6.31%) |
We can see, then, that there is much less uniformity when it comes to goalless draws in cup competitions. Some seasons it’s as low as 2.78% of games that end in a tie without the ball hitting the back of the net, whilst other times it can be as high as 11.69%. It also doesn’t seem as if the Football League’s decision to remove extra time from League Cup matches made much difference in terms of a drop in goalless draws.
Over these five seasons we can see the Cup games are less likely to finish 0-0 than in the League with teams in the EFL Cup by far the least likely to end goalless. With the removal of replay’s in the competition, and any chance of a lucrative second tie, there seems to be less incentive for lower league teams play defensively for a 0-0 draw.
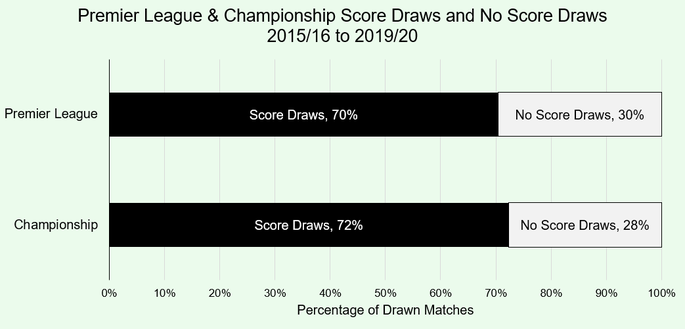
Score Draw vs No Score Draw
So, we now know what percentage of matches are drawn and how the leagues and cups differ. We also know how many games are goalless but what if you simply want to know what percentage of those drawn games are goalless, and what percentage have a score draw?
This not only applies to markets such as matches to draw and both teams to score but is crucial for anyone who plays or has played the football pools. Identifying which games will be score draws here can give you a chance of winning the pools.
Below we have a breakdown all draws between the 2015/16 season and the 2019/20 for both the Premier League and Championship.
Premier League Draws by Scoreline
| Score | 2015/16 | 2016/17 | 2017/18 | 2018/19 | 2019/20 | Total (% of draws) |
|---|---|---|---|---|---|---|
| 0-0 | 32 | 27 | 32 | 22 | 21 | 134 (29.58%) |
| 1-1 | 41 | 38 | 45 | 32 | 49 | 205 (45.25%) |
| 2-2 | 29 | 17 | 19 | 15 | 20 | 100 (22.08%) |
| 3-3 | 5 | 2 | 3 | 2 | 2 | 14 (3.09%) |
| 4-4 | 0 | 0 | 0 | 0 | 0 | 0 (0%) |
| 5-5 | 0 | 0 | 0 | 0 | 0 | 0 (0%) |
Championship Draws by Scoreline
| Score | 2015/16 | 2016/17 | 2017/18 | 2018/19 | 2019/20 | Total (% of Draws) |
|---|---|---|---|---|---|---|
| 0-0 | 57 | 34 | 49 | 39 | 32 | 211 (27.73%) |
| 1-1 | 85 | 65 | 65 | 68 | 75 | 358 (47.04%) |
| 2-2 | 29 | 27 | 27 | 47 | 35 | 165 (21.68%) |
| 3-3 | 1 | 3 | 6 | 7 | 6 | 23 (3.02%) |
| 4-4 | 0 | 1 | 0 | 0 | 1 | 2 (0.26%) |
| 5-5 | 0 | 0 | 1 | 1 | 0 | 2 (0.26%) |
We can see from these tables that just under 30% of Premier League draws are goalless with just under 28% of Championship draws ending without a goal scored. This means there is a good chunk of dull matches that football fans are putting up with when it comes to their league viewing. As a general rule for both leagues, one third of drawn matches will be no score draws, with two thirds score draws.
Of course, the trouble is that just because we know about 30% of drawn games will end without a goal being scored doesn’t mean that it’s necessarily easy to identify which of those games it will be.
In essence, the rule of thumb regardless of the competition that you’re watching and betting on is that there’s much more chance of at least one of the teams involved scoring than in neither of them doing so. This is something you’ll want to bear in mind when it comes to placing your wagers on matches throughout the season. The value might be high on a scoreless draw, but there’s a reason for that and bookmakers definitely aren’t stupid. Honest.