 Despite what you may think and what the performances of Premier League referees might lead you to believe, officials are there to uphold the Laws of the Game. If a player breaks one of those laws then the referee will take action, with one of the actions that happens is the awarding of a free kick. This is a way of re-starting the match that punishes the team of the offending player and rewards the team that suffered on account of what they did, offering a chance for a shot at goal, say, or to pump the ball into the box if it’s a tall team hoping to win the first ball.
As anyone who watched the likes of David Beckham, James Ward-Prowse or Luis Suarez play football will know, there are certain players who are expert free kick takers. They can, at the very least, test the goalkeeper, often managing to put the ball into the back of the net with the kick that they take. There are other teams that simply want to get the ball into the mixer with a free kick or use it as an opportunity to waste as much time as possible. Running the clock down can be just as important a use of a free kick as what you actually do with it. Here is a look at how many tend to be given in a match.
Quick Answer: How Many Free Kicks Are There in the Premier League?
Between the 2018-19 and 2023-23 seasons there were 45,792 free kicks awarded in the Premier League, an average of 24.1 per game. Of those, 1730 were attempts on goal, but just 98 resulted directly in a player scoring, an average of 19.6 per season.
James Ward-Prowse is the standout free kick goalscorer in this time with 15 goals. The next highest scorer is James Maddison with 8 goals, followed by Trent Alexander-Arnold with 5 goals and Kieran Trippier with 4 goals.
Total Free Kicks in the Premier League
Before we take an in-depth look at how things worked out for each team during recent seasons in the Premier League, we will first take a wider view, looking at the total for each season, so you can get a sense of how many free-kicks a referee is likely to give away during a game on average:
Premier League Free Kicks by Season – 2018-19 to 2022-23
| Season | Free-Kicks | Average Per Match |
|---|---|---|
| 2022-23 | 9,300 | 24.47 |
| 2021-22 | 8,778 | 23.10 |
| 2020-21 | 9,361 | 24.63 |
| 2019-20 | 9,244 | 24.32 |
| 2018-19 | 9,109 | 23.97 |
| Total | 45,792 | 24.10 |
In total, there were 45,792 free-kicks given away during the five seasons that we’re looking at. With 1,900 matches played during that time period, it equates to an average of 24.10 free-kicks per game over those five campaigns, which can be extrapolated over other seasons as we’ve looked as a decent period of time there.
How Many Free Kicks Become Goals?
Teams will use a certain portion of their free-kicks in order to have an attempt at goal. This is usually quite a small portion, relatively speaking, but how many of them actually end up in the back of the net?
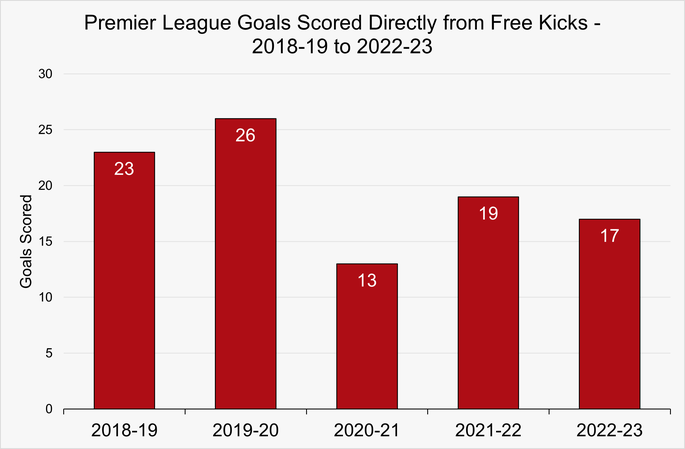
The short answer is: not many. Below is a look at each of the seasons that we’ve been focussing on, telling you how many free kicks there were, how many of those free kicks were attempts at goal, and how many actually ended up being goals.
Premier League Goals from Free Kicks – 2018-19 to 2022-23
| Season | Free Kicks | Goal Attempts | Goals |
|---|---|---|---|
| 2022-23 | 9,300 | 301 (3.24%) | 17 (0.18%) |
| 2021-22 | 8,778 | 337 (3.84%) | 19 (0.22%) |
| 2020-21 | 9,361 | 359 (3.84%) | 13 (0.14%) |
| 2019-20 | 8,865 | 379 (4.28%) | 26 (0.29%) |
| 2018-19 | 9,109 | 354 (3.89%) | 23 (0.25%) |
| Total | 45,413 | 1,730 (3.81%) | 98 (0.22%) |
In other words, if your team gets a free-kick in general, there is a 0.22% chance that it will end in a goal, on average.
We can also look at the conversion rate of free kick goal attempts to goals scored directly from a free kick.
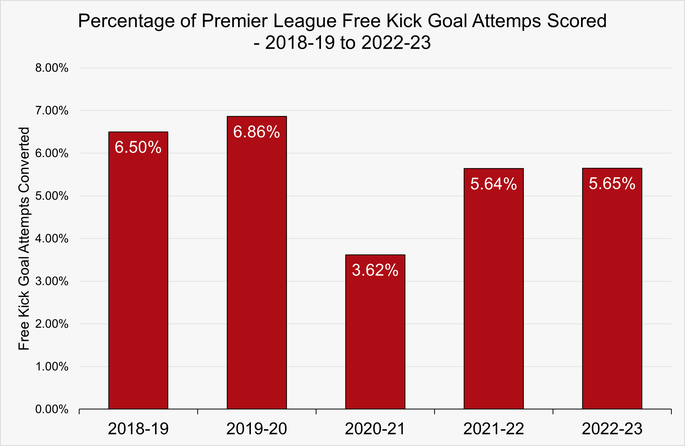
If they are in position to actually make an attempt at goal, there is a 5.66% chance that they will score it, on average. We all get excited when our team wins a free kick in what we would consider to be a dangerous position, but across five Premier League campaigns it is fairly clear that goals aren’t actually all that likely.
Some Players Are More Likely To Score Than Others
As you might imagine, some footballers are better than others when it comes to scoring goals from free kicks. There are many that have made a career out of, with the following being the players that scored two or more goals from dead-ball situations across the five seasons in question:
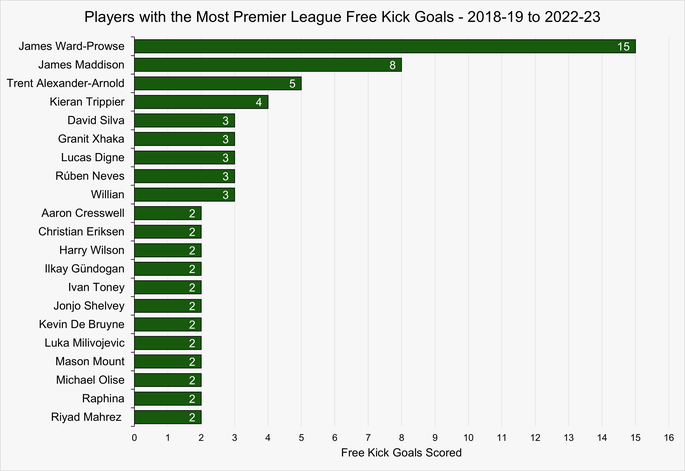
As you can see, there are clearly some free kick specialists in the league, with no one managing to do better than James Ward-Prowse from a dead-ball situation. What we can’t tell you is how many attempts at goal the players had before they managed to find the back of the net, but it is fair to say that if certain players are lining up to take the free kick then there is more chance of a goal than if someone else is trying to take it.
Premier League Free Kicks by Club
We now know how many free-kicks are taken in a Premier League football match on average. Next, we can look at the number of free-kicks that are taken during the course of a season by each club. Here is a look at five Premier League campaigns between 2018-19 and 2022-23, investigating how many free-kicks each of the teams took:
2022-23 Season Free Kicks
| Team | Passes | Shots | Total | Av. Per Game |
|---|---|---|---|---|
| Arsenal | 516 | 16 | 532 | 14.00 |
| Aston Villa | 599 | 18 | 617 | 16.23 |
| Bournemouth | 424 | 14 | 438 | 11.53 |
| Brentford | 453 | 14 | 467 | 12.29 |
| Brighton & Hove Albion | 445 | 12 | 457 | 12.03 |
| Chelsea | 503 | 10 | 513 | 13.50 |
| Crystal Palace | 525 | 23 | 548 | 14.42 |
| Everton | 434 | 12 | 446 | 11.74 |
| Fulham | 471 | 17 | 488 | 12.84 |
| Leeds United | 484 | 19 | 503 | 13.24 |
| Leicester City | 464 | 14 | 478 | 12.58 |
| Liverpool | 416 | 7 | 423 | 11.13 |
| Manchester City | 440 | 20 | 460 | 12.11 |
| Manchester United | 325 | 20 | 345 | 9.08 |
| Newcastle United | 447 | 15 | 462 | 12.16 |
| Nottingham Forest | 446 | 9 | 455 | 11.97 |
| Southampton | 426 | 17 | 443 | 11.66 |
| Tottenham Hotspur | 404 | 13 | 417 | 10.97 |
| West Ham United | 347 | 13 | 360 | 9.47 |
| Wolverhampton Wanderers | 430 | 18 | 448 | 11.79 |
| Total | 8,999 | 301 | 9,300 | 24.47 |
During the 2022-23 campaign, there were 9,300 free-kicks taken in total. Of those, 301 were attempts at goal, which is 3.24% of the total.
In terms of the average number of free-kicks per match, there were 380 games played during the season, meaning 24.47 free-kicks on average for each 90 minutes.
2021-2022 Season Free Kicks
| Team | Passes | Shots | Total | Av. Per Game |
|---|---|---|---|---|
| Arsenal | 404 | 21 | 425 | 11.18 |
| Aston Villa | 525 | 20 | 545 | 14.34 |
| Brentford | 432 | 11 | 443 | 11.66 |
| Brighton & Hove Albion | 390 | 15 | 405 | 10.66 |
| Burnley | 370 | 14 | 384 | 10.11 |
| Chelsea | 434 | 26 | 460 | 12.11 |
| Crystal Palace | 528 | 13 | 541 | 14.24 |
| Everton | 413 | 18 | 431 | 11.34 |
| Leeds United | 417 | 13 | 430 | 11.32 |
| Leicester City | 457 | 14 | 471 | 12.39 |
| Liverpool | 436 | 13 | 449 | 11.82 |
| Manchester City | 406 | 17 | 423 | 11.13 |
| Manchester United | 376 | 19 | 395 | 10.39 |
| Newcastle United | 415 | 15 | 430 | 11.32 |
| Norwich City | 474 | 18 | 492 | 12.95 |
| Southampton | 411 | 24 | 435 | 11.45 |
| Tottenham Hotspur | 430 | 16 | 446 | 11.74 |
| Watford | 394 | 24 | 418 | 11.00 |
| West Ham United | 309 | 13 | 322 | 8.47 |
| Wolverhampton Wanderers | 420 | 13 | 433 | 11.39 |
| Total | 8,441 | 337 | 8,778 | 23.10 |
With 8,778 free-kicks taken in the 2021-22 season, you can see it’s down slightly on the 2022-23 campaign. Of those, 337 were attempts at goal, which works out as 3.84% of all free-kicks being shots.
In terms of the average number of free-kicks per game, that comes in at 23.10.
2020-2021 Season Free Kicks
| Team | Passes | Shots | Total | Av. Per Game |
|---|---|---|---|---|
| Arsenal | 440 | 23 | 463 | 12.18 |
| Aston Villa | 590 | 16 | 606 | 15.95 |
| Brighton & Hove Albion | 404 | 15 | 419 | 11.03 |
| Burnley | 461 | 15 | 476 | 12.53 |
| Chelsea | 402 | 16 | 418 | 11.00 |
| Crystal Palace | 473 | 18 | 491 | 12.92 |
| Everton | 426 | 15 | 441 | 11.61 |
| Fulham | 469 | 12 | 481 | 12.66 |
| Leeds United | 467 | 9 | 476 | 12.53 |
| Leicester City | 474 | 20 | 494 | 13.00 |
| Liverpool | 404 | 22 | 426 | 11.21 |
| Manchester City | 423 | 21 | 444 | 11.68 |
| Manchester United | 433 | 21 | 454 | 11.95 |
| Newcastle United | 464 | 25 | 489 | 12.87 |
| Sheffield United | 347 | 5 | 350 | 9.21 |
| Southampton | 496 | 20 | 516 | 13.58 |
| Tottenham Hotspur | 524 | 35 | 559 | 14.71 |
| West Bromwich Albion | 463 | 16 | 479 | 12.61 |
| West Ham United | 398 | 17 | 415 | 10.92 |
| Wolverhampton Wanderers | 444 | 18 | 462 | 12.16 |
| Total | 9,002 | 359 | 9,361 | 24.63 |
The 2020-21 campaign was an unusual one, with most of it played behind closed doors due to the global health situation of the time. Did it change what happened to free kicks? There wasn’t a huge different in the 2021-20 season compared to those that would come after, with 9,361 free kicks taken in total. Of those, 359 were attempts at goal, which works out as 3.84%.
On average, there were 24.63 free-kicks per game during the season.
2019-2020 Season Free Kicks
| Team | Passes | Shots | Total | Av. Per Game |
|---|---|---|---|---|
| Arsenal | 487 | 19 | 506 | 13.32 |
| Aston Villa | 562 | 21 | 583 | 15.34 |
| Bournemouth | 450 | 21 | 471 | 12.39 |
| Brighton & Hove Albion | 394 | 11 | 405 | 10.66 |
| Burnley | 408 | 18 | 426 | 11.21 |
| Chelsea | 401 | 29 | 430 | 11.32 |
| Crystal Palace | 501 | 15 | 516 | 13.58 |
| Everton | 463 | 20 | 483 | 12.71 |
| Leicester City | 495 | 20 | 515 | 13.55 |
| Liverpool | 440 | 20 | 460 | 12.11 |
| Manchester City | 352 | 27 | 379 | 9.97 |
| Manchester United | 466 | 33 | 499 | 13.13 |
| Newcastle United | 463 | 14 | 477 | 12.55 |
| Norwich City | 461 | 16 | 477 | 12.55 |
| Sheffield United | 375 | 4 | 379 | 9.97 |
| Southampton | 448 | 27 | 475 | 12.50 |
| Tottenham Hotspur | 464 | 21 | 485 | 12.76 |
| Watford | 398 | 18 | 416 | 10.95 |
| West Ham United | 432 | 13 | 445 | 11.71 |
| Wolverhampton Wanderers | 405 | 12 | 417 | 10.97 |
| Total | 8,865 | 379 | 9,244 | 24.33 |
The 2019-20 campaign was unusual, insomuch as it saw a break arrive towards the end and the final few games were played behind-closed-doors thanks to the global health crisis. It was Liverpool’s first Premier League title since the re-brand, but how did it work out in terms of free kicks?
With 9,244 free kicks taken in total across the 2019-20 campaign, 379 of them were attempts to score a goal. That works out as 4.10%, which is the most we’ve seen so far.
The average number of free kicks awarded per match worked out at 24.33, which is in line with the other seasons we’ve looked at so far.
2018-2019 Season Free Kicks
| Team | Passes | Shots | Total | Av. Per Game |
|---|---|---|---|---|
| Arsenal | 543 | 11 | 554 | 14.58 |
| Bournemouth | 512 | 16 | 528 | 13.89 |
| Brighton & Hove Albion | 330 | 12 | 342 | 9.00 |
| Burnley | 395 | 14 | 409 | 10.76 |
| Cardiff City | 423 | 13 | 436 | 11.47 |
| Chelsea | 471 | 30 | 501 | 13.18 |
| Crystal Palace | 435 | 16 | 451 | 11.87 |
| Everton | 495 | 20 | 515 | 13.55 |
| Fulham | 412 | 10 | 422 | 11.11 |
| Huddersfield Town | 444 | 15 | 459 | 12.08 |
| Leicester City | 453 | 19 | 472 | 12.42 |
| Liverpool | 463 | 20 | 483 | 12.71 |
| Manchester City | 344 | 21 | 365 | 9.61 |
| Manchester United | 435 | 27 | 462 | 12.16 |
| Newcastle United | 389 | 16 | 405 | 10.66 |
| Southampton | 409 | 20 | 429 | 11.29 |
| Tottenham Hotspur | 457 | 23 | 480 | 12.63 |
| Watford | 483 | 22 | 505 | 13.29 |
| West Ham United | 501 | 17 | 518 | 13.63 |
| Wolverhampton Wanderers | 361 | 12 | 373 | 9.82 |
| Total | 8,755 | 354 | 9,109 | 23.97 |
The final season that we’ve looked at is the 2018-19 campaign. There were 9,109 free kicks taken during the 2018-19 season, with 354 of them being shots on goal. That equates to 3.89% of the shots in total.
Over the course of the season, the average number of free-kicks given in a match was 23.97.