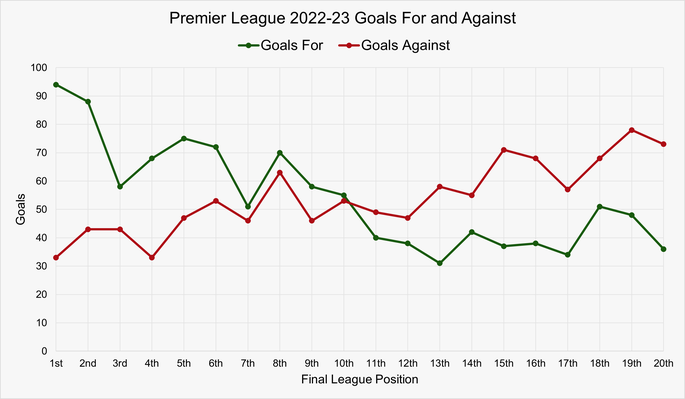
 When it comes to football seasons, they are long and arduous. In the Premier League, for example, 20 teams play 380 games between them, with the campaign typically lasting from August until the following May. That has been a bit different in recent years on account of the global health emergency and the World Cup being played in the middle of the 2022-2023 season, but as a rule of thumb it is 380 games played over a period of ten months. You would think, therefore, that that would be plenty of time to separate the teams vying for the title.
In fairness, 380 games has been more than enough to separate the teams in the Premier League on all but one occasion, which was when Manchester City pipped their city rivals to the title at the end of the 2011-2012 campaign. Look further afield than the Premier League though, including when it was the English First Division before 1992, and you can find more than a few occasions of when something other than just points won has been needed to separate the teams at the top come the end of the campaign. Interestingly, goal difference isn’t always the only deciding factor.
Quick Answer: How Often is the League Title Won on Goal Difference?
The English Football League title has twice been decided by goal difference (and then goals scored) since the system was introduced in 1976-77.
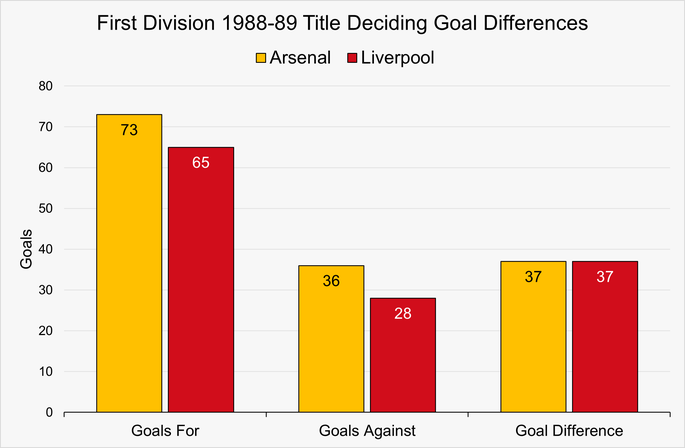
The first winners were Arsenal during the 1988-89 season where they finished both level on points and goal difference with Liverpool but were crowned champions due to a superior goals scored count.
The second was Manchester City during the 2011-12 season when they won the league thanks to their superior goal difference with runners-up Manchester United
Previously, when teams were tied on points it would be goal average that would be the deciding factor. This was the case for champions Huddersfield in 1923-24, Portsmouth in 1949-50, Arsenal in 1952-53 and Manchester United in 1964-65.
Goal Difference Explained
![]()
Before we take a look at the various league campaigns that have been required to look at goal difference in order to decide the destination of the title, it is worth explaining exactly what goal difference is. On top of that, it might be worth looking at what else has been used over the years to help figure out which team has ended up as champions in various divisions. When it comes to competitions, there is a need to have a tie-breaker in the event that one or more teams manage to finish on the same number of points at the end of the season, so as to be able to declare an outright winner.
In a lot of cases, goal difference is the tie-breaker that is used, being the difference in goals scored and goals conceded across all of the matches played. Imagine a scenario in which Team A has scored 57 goals during the campaign and conceded 22. That would mean that the team’s goal difference is 57-22, which equals 35. Another team has scored 100, but conceded 75, meaning that their goal difference is 25. Team A, therefore, has a better goal difference than Team B and would win the title, even though Team B actually scored more goals during the season.
Goal difference was first used as a tie-breaker in the 1970 World Cup, becoming the standard tie-breaker in the English Football League five years after that. Since then, it has spread to most football leagues around the world as the first factor to decide the difference between teams if they can’t be separated according to the points that they’ve won. In some cases, goal difference alone isn’t enough and something such as the head-to-head between the two teams or goals scored will be used in order to decide upon the eventual winner of the league campaign.
Famous Examples Of Goal Difference Deciding The League Winners
Here we will look at some of the famous examples from around the world where goal difference or some other factor has been used in order to decided upon the destination of the title. Whilst there are plenty of examples from the United Kingdom, especially if you look further down the football league, there have also been some interesting ones from abroad over the years. Rather than look at every single example in detail, we’ll just focus on the more interesting examples:
Manchester City & Manchester United: 2011-2012
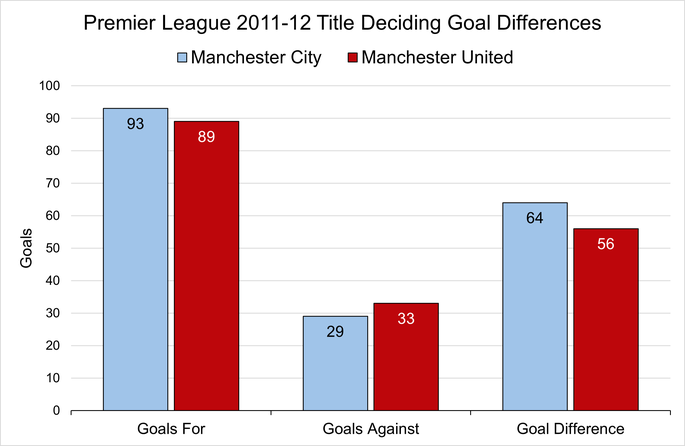
When it comes to league titles decided according to goal difference, there is perhaps no more painful way to lose out on the league than to your fierce city rival. That is exactly what happened in 2011-2012, where Manchester City were vying for their first title of the Premier League era in the wake of the club’s takeover by Sheikh Mansour of the United Arab Emirates. The two clubs had been going head-to-head for the majority of the season, as proven by the fact that third-placed Arsenal ended up 19 points adrift at the end of the campaign.
As the final day of the season arrived, the two teams were level on points, with Manchester United travelling to Sunderland for their game and Manchester City playing at home to Queens Park Rangers. When the final whistle went in the United game there were actual at the top of the table, having won 1-0. The City game had them losing 2-1 heading into injury time, only for two goals in quick succession to see the title ripped from Alex Ferguson’s grasp in arguably the most dramatic circumstances ever. City finished the campaign with a goal difference of +64, compared to United’s +56.
Arsenal & Liverpool: 1988-1989
For Liverpool supporters, the 1988-1989 season will always be one of the most tragic in the club’s history, given that the Hillsborough Disaster resulted in the loss of 97 lives, entirely because of police negligence. The fight for justice would last for more than 30 years, but the tragedy also meant that many at Anfield on the final day of the season would have their mind on events outside what was taking place on the pitch. Even so, what did happen was something rather remarkable, given that it pitted the team in first place against the team in second in the season’s final match.
If Liverpool managed to win or draw then the title was theirs, which would also be the case provided they only lost by a single goal. Lose by any more than that, however, and the title would belong to the Gunners. As the sun beat down on Merseyside, the two clubs went into the break level and the title was all but Liverpool’s. Though Alan Smith scored early in the second-half, it was still the Merseysiders that would be crowned champions as the match entered stoppage time. Liverpool hearts were broken, however, when Micheal Thomas scored in the 91st minute to claim the title for the North London side.
Interestingly, the two teams not only finished the campaign on the same number of points but also had the same goal difference, which was +37, but Arsenal scored more goals than Liverpool across the course of the campaign, finding the net 73 times compared to Liverpool’s 65, handing them the title accordingly.
PSV Eindhoven & Ajax: 2006-2007
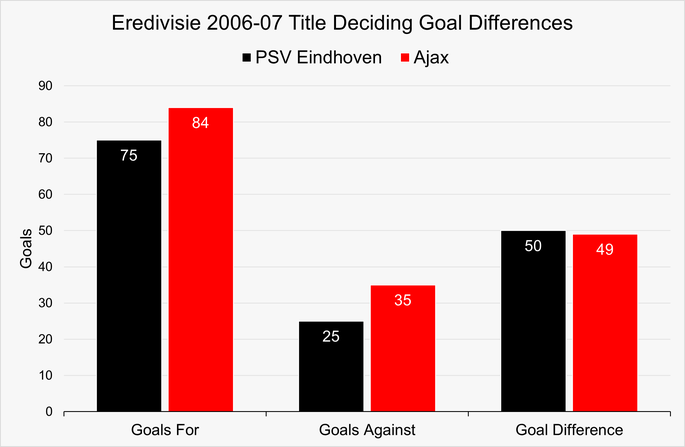
When the Eredivisie entered its final matches at the end of the 2006-2007 campaign, it did so with all of AZ Alkmaar, Ajax and PSV Eindhoven on 72 points. PSV were hoping to win their third consecutive title, whilst Ajax were hoping to win their first since 2004 and AZ Alkmaar hadn’t won it since 1981. In the end, AZ Alkmaar lost 3-2 in a shock result to Excelsior, meaning that they were out of the running. With just a single goal in it when it came to the goal difference of Ajax and PSV before the match got underway, it looked like the title was Ajax’s when they went 2-0 up.
In the PSV Eindhoven match, meanwhile, the team, playing at home, scored twice in the opening ten minutes only to concede three minutes later, meaning that they went in 2-1 up at half-time. Two more second-half goals for PSV meant that they and Ajax were not only level on points but also on goal difference, with Ajax’s better goals scored ratio meaning that they looked like the likely winners. In the 77th minute, however, Philip Cocu scored to make it 5-1 to PSV, ensuring that they would finish the season with a goal difference of +50 compared to Ajax’s +49, winning the title by a single goal.
Debreceni VSC & Győri ETO FC: 2013-2014
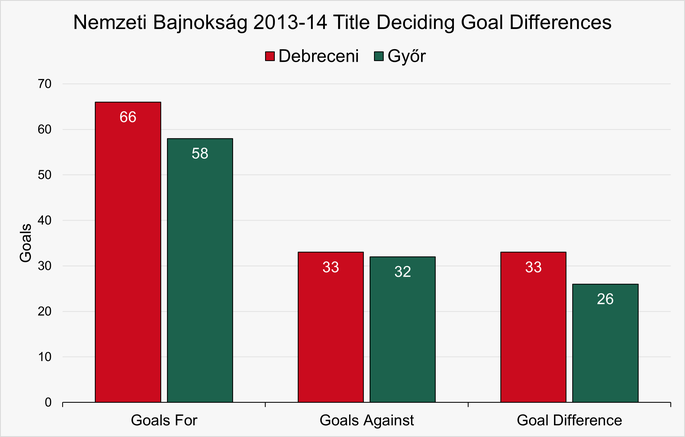
If we’re all honest, the Hungarian top-flight probably isn’t one of the divisions that is high on the list of competitions that we’re likely to tune into. Perhaps things might have been different at the end of the 2013-2014 campaign, however, if we’d realised just how exciting the conclusion to the league season was. Both Debreceni VSC and Győri ETO FC were heading into the last game of the Nemzeti Bajnokság I with a chance of winning the title, with a loss for Debrecen and a win for Győr would mean that goal difference would have to be the deciding factor in the league.
The bad news for Győr was that they needed a swing of 14 goals for them to win the title, given the fact that that was how many more goals Debrecen had than them. When Debrecen lost their game 2-0, there really was a belief that Győr could pull off the impossible. In the end, however, they could only win their match 5-0, meaning that both teams ended the campaign on 62 points but the title went to Debrecen for the seventh time since 2005 thanks to a superior goal difference. In the end, Debrecen had a GD of +33 compared to Győr’s +26.
Breiðablik UBK, ÍBV v& FH Hafnarfjörður
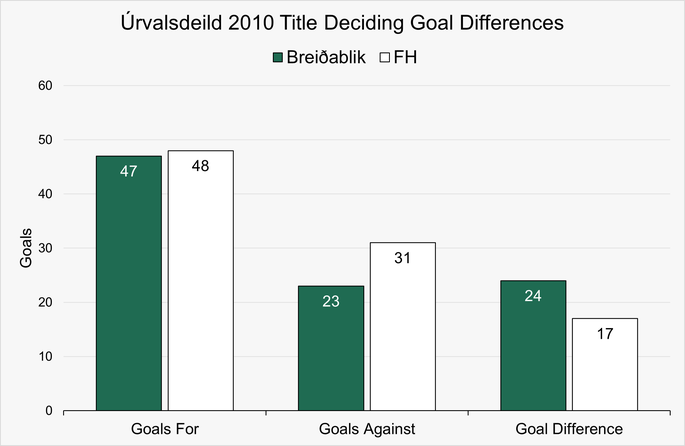
If the Hungarian top-flight isn’t going to appeal then it is extremely unlikely that life in Iceland’s first division is going to be something you know all that much about. You might well change your mind when you hear about the 2010 season in the Úrvalsdeild, however. As with the Eredivisie three years earlier, there were three teams that had a chance of winning the title on the final day of the season. Kópavogur-based Breiðablik were leading the rankings as the games kicked off, safe in the knowledge that a win would see them gain their first ever Icelandic title.
Trailing them by a single point was ÍBV from Vestmannaeyjar, who had already won the title three times before, whilst FH were the defending champions and were two points behind the leaders. ÍBV were playing their final game at Keflavík and were losing 2-0 with 16 minutes to go, pulling one goal back before ultimately losing 4-1 and dropping out of the race. Breiðablik drew 0-0 with Stjarnan, meaning that FH could win the league if they were able to win their match and overturn a goal difference of 11. In the end, they won 3-0, securing the title for Breiðablik by 7 goals.
Other Goal Difference League Wins
If we look at other English and Scottish Football League divisions we can find further instances of the champions being decided by goal difference. These are shown below.
Other British Goal Difference League Wins
| Season | Division | Winner (GD) | Runner-Up (GD) |
|---|---|---|---|
| 1983-1984 | English Second | Chelsea (+50) | Sheffield Wednesday (+38) |
| 1989-1990 | English Second | Leeds United (+27) | Sheffield United (+20) |
| 1981-1982 | English Third | Burnley (+21) | Carlisle United (+15) |
| 2016-2017 | English League 2 | Portsmouth (+39) | Plymouth Argyle (+25) |
| 2021-2022 | English League 2 | Forest Green Rovers (+31) | Exeter City (+24) |
| 1985-1986 | Scottish Premier | Celtic (+29) | Heart of Midlothian (+26) |
| 2003-2004 | Scottish Premier | Rangers (+73) | Celtic (+72) |
English Title Winners by Goal Average
In England, the stat that decided the difference between the title winner and the runner-up in the event that both teams finished on the same number of points used to be goal average. This is where the number of goals scored was divided by the number of goals conceded, to give a ratio of goals for to goals against for each team. This was the decider from the first football league season in 1889-90 until 1975-76. From the 1976-77 season this changed to goal difference. The likes of Huddersfield Town won the title this way in 1924, for example, as did Arsenal against Preston North End in 1953. A full list of winners by goal average is shown below.
Goal Average English Title Winners
| Season | Winner (GA) | Runner-Up (GA) |
|---|---|---|
| 1923-24 | Huddersfield Town (1.82) | Cardiff City (1.79) |
| 1949-50 | Portsmouth (1.95) | Wolverhampton Wanderers (1.55) |
| 1952-53 | Arsenal (1.52) | Preston North End (1.42) |
| 1964-65 | Manchester United (2.28) | Leeds United (1.60) |