 For European football clubs, there is no bigger stage on which to play than the Champions League. Rebranded from the European Cup in 1992, the competition is the pinnacle of European club football and every single team that plies its trade on the continent wants to make it as far as possible in the tournament. That, of course, can lead to sides being overly-sensible when it comes to the matches that they play in, often favouring caution over a gung-ho attitude in the hope that that will see them through.
That is often even more evident in the knockout stages, when the slightest mistakes can see a team end up being out of the competition at the first time of asking. Up until the 2021-2022 campaign, the away goals rule made it even more likely that a side would end up exiting the competition relatively easily, simply because they conceded a goal at home that counted for more than the ones that the home side scored. Does the actual evidence stand up to that theory? Are there more goals in group stage matches than other stages of the tournament?
How Many Goals Are Scored on Average in the Champions League?
In the 29 Champions League seasons between 1992-93 and 2020-21, there were 7286 goals scored in the group stages, 808 in the round of 16, 581 in the quarter-finals, 276 in semi-finals and 78 in the finals.
The highest number of goals scored per game occurs during the round of 16 with 2.80, closely followed by the group stages with 2.75 and the quarter-finals and finals both with 2.68. The round with the lowest number of goals per game are the semi-finals, with 2.46 goals per game on average.
The Champions League Goal Stats
Since the launch of the Champions League in its rebranded format in 1992, there have been more than a few thrilling matches in Europe’s elite competition. Are such games the norm, or the exception that proves the rule? The only real way to get a sense of this is by looking at the statistics from the 29 seasons that have been played out to date. Lets start by looking at the total number of goal scored in the competition between the 1992-1993 season and the 2020-2021 season.
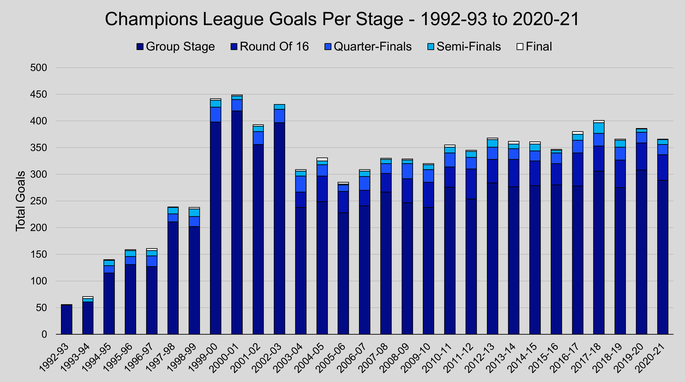
What complicates matters slightly is that there were two group stages to the Champions League between the 1999-2000 season and the 2002-2003 campaign. For that reason, we’ll look at the average number of goals per match.
Rather than looking at each individual group, we’ve decided to lump the group stage together each year. Again, we’ll divide the number of goals scored by the number of games played in order to get a sense of how regularly goals have been scored at each stage of the competition.
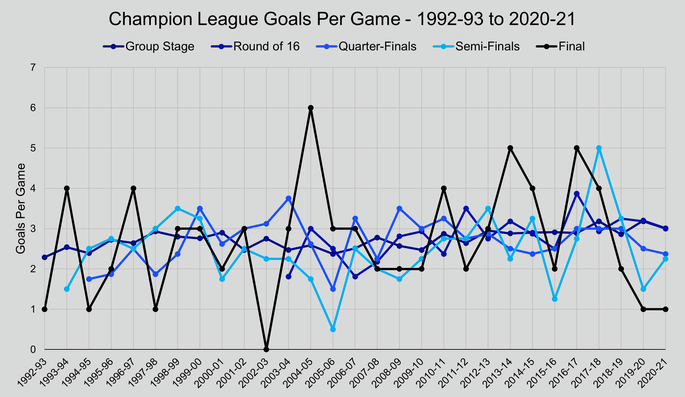
You can see from the charts above that there have been some years when the goals were flying in throughout the competition, whilst in others it was seemingly impossible to even buy one at certain stages. Of course, certain matches will always skew the data slightly, which is something that needs to be borne in mind. In the 2018-2019 season, for example, Manchester City defeated Shakhtar Donetsk 6-0 in a group stage game, whilst Liverpool defeated Porto 6-1 on aggregate in the quarter-finals. They also lost 3-0 to Barcelona in the semi-final first-leg, then won the second-leg 4-0.
Which Round Sees The Most Goals Per Game?

Having looked at the competition as a whole, it is now worth having a more in-depth look at each stage of the competition in order to assess which one sees the most goals go in on average. It would make sense for this to be the group stage, given a defeat isn’t going to spend the end for a team in most of the individual games, but might it be the case that once the knockout round starts teams begin to be more threatening as they fear being knocked out of the competition?
Here’s a look at the total number of goals scored and the total number of games played in each round across the 29 seasons of Champions League football since its relaunch under that moniker in 1992. Obviously there are some seasons in the early days when there were only two groups and the winners went straight to the final, which is why working out the average is important rather than the total goals scored in each round.
Champions League Average Goals Per Game – 1992-93 to 2020-21
| Stage | Goals | Games | Average |
|---|---|---|---|
| Group Stage | 7,286 | 2,640 | 2.75 |
| Round Of 16 | 808 | 288 | 2.80 |
| Quarter-Final | 581 | 216 | 2.68 |
| Semi-Final | 276 | 112 | 2.46 |
| Final | 78 | 29 | 2.68 |
The Round of 16 is the point of the Champions League season in which more goals are scored than any other, with the ball hitting the back of the net 808 times across 288 matches for an average goals per game figure of 2.80. The groups stage isn’t far behind that, in fairness, whist it’s interesting to see that the quarter-finals and final have the same average goals per game figure. It seems as though it is the semi-final stage when teams become a little less reluctant to try to score, perhaps because the final feels so close.
Table of Champions League Goals by Round
Below is a complete table of the number of goals per round in the Champions League each season between 1992-93 and 2020-21
Champions League Goals Per Round Per Season – 1992-93 to 2020-21
| Season | Group Stage | Round of 16 | Quarter-Finals | Semi-Finals | Final |
|---|---|---|---|---|---|
| 1992-93 | 55 | N/A | N/A | N/A | 1 |
| 1993-94 | 61 | N/A | N/A | 6 | 4 |
| 1994-95 | 115 | N/A | 14 | 10 | 1 |
| 1995-96 | 131 | N/A | 15 | 11 | 2 |
| 1996-97 | 127 | N/A | 20 | 10 | 4 |
| 1997-98 | 211 | N/A | 15 | 12 | 1 |
| 1998-99 | 202 | N/A | 19 | 14 | 3 |
| 1999-00 | 398 | N/A | 28 | 13 | 3 |
| 2000-01 | 419 | N/A | 21 | 7 | 2 |
| 2001-02 | 356 | N/A | 24 | 10 | 3 |
| 2002-03 | 397 | N/A | 25 | 9 | 0* |
| 2003-04 | 238 | 29 | 30 | 9 | 3 |
| 2004-05 | 249 | 48 | 21 | 7 | 6 |
| 2005-06 | 228 | 40 | 12 | 2 | 3 |
| 2006-07 | 241 | 29 | 26 | 10 | 3 |
| 2007-08 | 267 | 35 | 18 | 8 | 2 |
| 2008-09 | 247 | 45 | 28 | 7 | 2 |
| 2009-10 | 238 | 47 | 24 | 9 | 2 |
| 2010-11 | 276 | 38 | 26 | 11 | 4 |
| 2011-12 | 254 | 56 | 22 | 11 | 2 |
| 2012-13 | 284 | 44 | 23 | 14 | 3 |
| 2013-14 | 277 | 51 | 20 | 9 | 5 |
| 2014-15 | 279 | 46 | 19 | 13 | 4 |
| 2015-16 | 280 | 40 | 20 | 5 | 2 |
| 2016-17 | 278 | 62 | 24 | 11 | 5 |
| 2017-18 | 306 | 47 | 24 | 20 | 4 |
| 2018-19 | 275 | 52 | 24 | 13 | 2 |
| 2019-20 | 308 | 51 | 20 | 6 | 1 |
| 2020-21 | 289 | 48 | 19 | 9 | 1 |
* Indicates that there were zero goals scored in normal time and extra-time, with penalties being used to settle the tie.