 Football is a game of fine margins. Goals are the most important currency, which is why the world’s best strikers cost so much money for teams to bring in. Equally, top-level goalkeepers and defenders will set a team back a fair amount, given their importance to a team that is trying to win the biggest trophies in football. For those at the bottom of leagues, goals scored for and against the teams can be the difference between survival and relegation. In amongst all that, then, come own goals, which can be disastrous.
The problem with own goals is that, by their very nature, they can’t be planned for. The players scoring them don’t intend to do it, so managers can’t add them into their plans for how a match is likely to develop. Instead, they are completely random and yet can have a huge impact on the outcome of a football match. As a bettor, all you can do is to think about how often they tend to be scored, bearing that in mind when you’re placing bets on the likes of the Over / Under or on the Total Goals scored in a game that you’re betting on.
How Own Goal Affect Bets
One of the first things that you’ll want to think about is the ways in which an own goal might end up affecting your bet. Some bookmakers actually do offer an own goal market, up to and including which players are likely to be the offenders on that front. Mostly, though, an own goal is likely to affect your bet in a different way, if you have chosen to place what you might refer to as a more mainstream wager. There are some bets that if won’t have any affect on, whilst others can become winners or losers as a result.
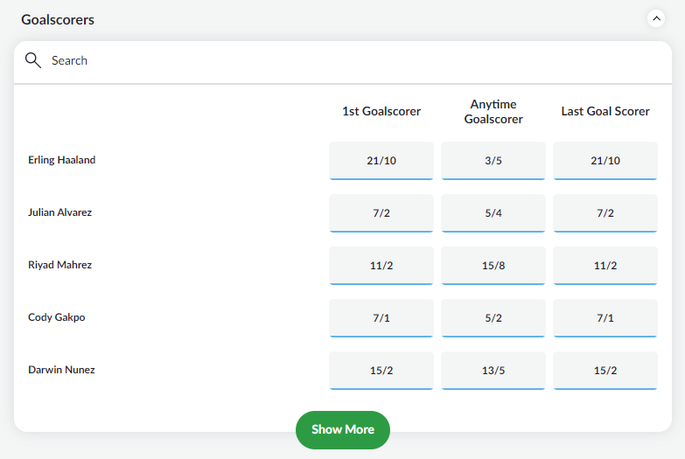
Own goals are always excluded from Goalscorer markets, presuming that you’re picking a specific player. In other words, if you’ve got a bet on a First or Last Goalscorer and the first or last goal in a 3-0 win is an own goal, it will be the middle goal that counts towards your bet, depending on the wager that you placed. If you bet on ‘No Goalscorer’ and the game finishes 1-1 with both goals being own goals, you will still be paid out on your bet. The bets it won’t affect are those placed on the result or the Correct Score.
If you place a wager on team X winning a game, it doesn’t matter if all of the goals for that team are own goals scored by the opposition in a 10-0 win, you’ll still win your bet. In the same way, if you bet on the Correct Score being 3-1 and all four goals are own goals, you will still win your bet as long as they are scored the correct way round. The shorthand way of thinking about it is that own goals will not be counted if the specific goalscorer is what you’ve bet on, but they will be if it is the number of goals that you’ve placed your wager on.
Own Goals In The Premier League
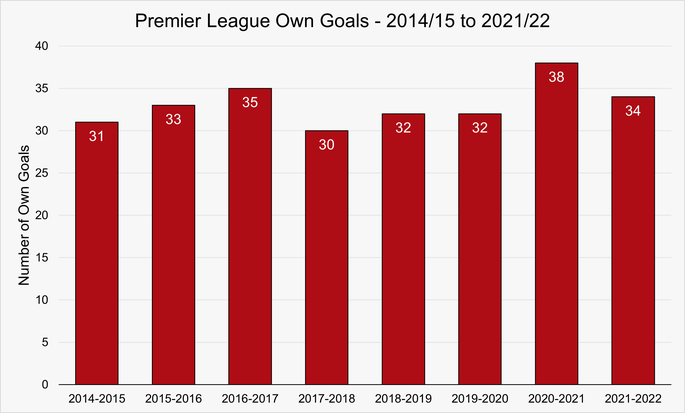
It is obviously possible to look at any of the top divisions across Europe when discussing own goals, but it makes sense to look at the Premier League given the manner in which it is considered to be the best league in the world. Here is a look at the number of own goals that were scored across a number of top-flight seasons:
We can then look at what the percentage then works out at when measured against the total goals that season:
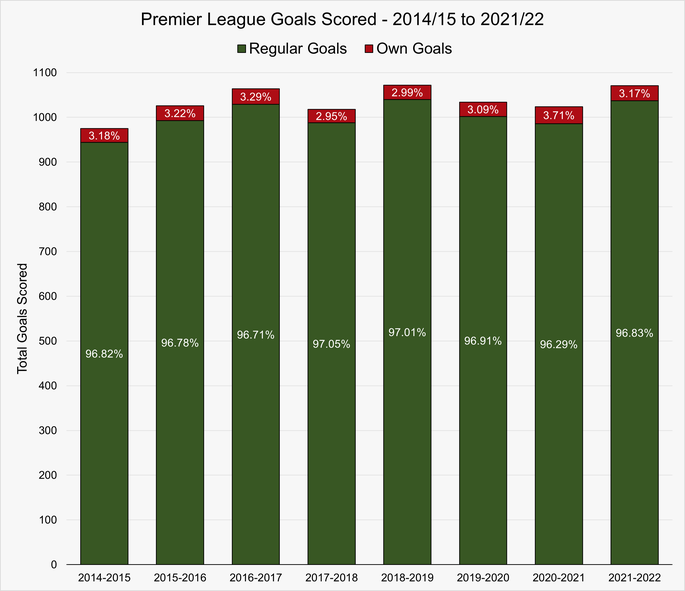
You can see, then, that between 2.95% and 3.71% of all goals scored in a Premier League season are likely to be own goals. Roughly one in ten matches is likely to feature an own goal in a campaign where 380 matches are played. That is something that needs to be borne in mind, but not necessarily to dictate your approach to placing wagers on Premier League matches.
Are Some Positions More Liable To Score Own Goals Than Others?
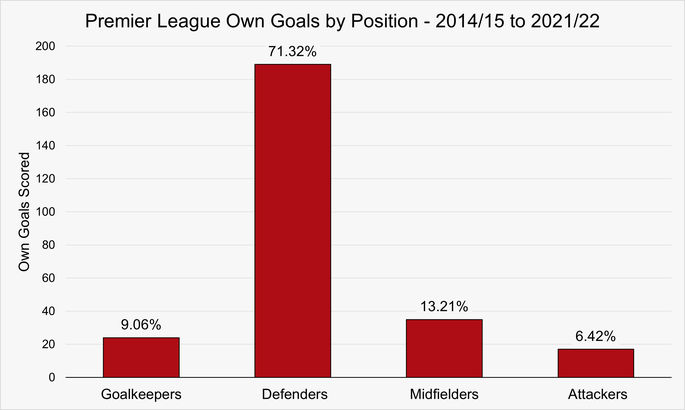
Now that we know how often own goals tend to be scored in the Premier League, it its worth asking the question of whether one position is more likely to see own goals scored than others during the course of the season. Given the fact that you need to be close to the goal to put the ball into it, it would fair to surmise that defenders and goalkeepers are more likely to score them than defenders. The question is, is that true?
For the purposes of ease, we have included any defender, whether they be a centre back, right-back or even wing-back, as a defensive player and any midfielder in the midfield. This means that some players might be wingers, so could easily be considered to be a player that plays as a forward, but we have put them down in the midfield in the above table. Equally, if a player is typically considered to be a forward then that is how we have classified them here. You might think that some players are actually a forward rather than an attacking midfielder, for example.
What the information here tells us is that defensive players are easily the most likely to score own goals during football matches. Indeed, when breaking this information down further (see final section) there was no season in which all of the own goals scored by the other positions combined out-numbered those scored by defenders. If an own goal is coming, the percentage chance of it being from a defender is extremely high. That makes sense, of course, given the nature of their role, but it is worth bearing in mind when you think about whether or not an own goal is likely to occur.
Do Some Teams Concede More Own Goals Than Others?
You might well imagine that some teams tend to be in a position where they’re having to defend more deeply than others on a consistent basis. The sides that are often fighting the threat of relegation are obviously more likely to drop deep and try to stop the opposition scoring than they are to play open, expansive football, for example. Does this mean that they tend to concede own goals on a more regular basis than those that are on the front foot more often than not? Is it another factor in the own goal saga?
The Premier League is set up in a way that means that teams can be promoted into it and relegated out of it. As such, there is no consistent set of 20 teams that compete in the English top-flight year-in, year-out. Instead, teams at the bottom tend to come and go over the course of the time that they’re competing to be in the top-flight and then remain in it. Here is a look at the number of own goals scored by each team that has played Premier League football between the start of the division and the end of the 2021-2022 season:
Total Premier League Own Goals Conceded by Team – 1992/93 to 2021/22
| Team | Own Goals | Seasons | Own Goals Per Season |
|---|---|---|---|
| Everton | 59 | 30 | 1.97 |
| Aston Villa | 50 | 27 | 1.85 |
| Arsenal | 46 | 31 | 1.48 |
| West Ham United | 45 | 26 | 1.73 |
| Manchester United | 44 | 30 | 1.47 |
| Liverpool | 41 | 30 | 1.37 |
| Southampton | 41 | 23 | 1.78 |
| Chelsea | 39 | 30 | 1.30 |
| Fulham | 39 | 16 | 2.44 |
| Manchester City | 39 | 25 | 1.56 |
| Sunderland | 39 | 16 | 2.44 |
| Newcastle United | 36 | 27 | 1.33 |
| Leicester City | 32 | 16 | 2.00 |
| West Bromwich Albion | 30 | 13 | 2.31 |
| Middlesbrough | 29 | 15 | 1.93 |
| Blackburn Rovers | 26 | 18 | 1.44 |
| Bolton Wanderers | 23 | 13 | 1.77 |
| Queens Park Rangers | 22 | 7 | 3.14 |
| Norwich City | 21 | 10 | 2.10 |
| Watford | 21 | 8 | 2.63 |
| Stoke City | 20 | 10 | 2.00 |
| Crystal Palace | 19 | 13 | 1.46 |
| Leeds United | 17 | 14 | 1.21 |
| Swansea City | 17 | 7 | 2.43 |
| Wolverhampton Wanderers | 17 | 8 | 2.13 |
| Burnley | 16 | 8 | 2.00 |
| Hull City | 16 | 5 | 3.20 |
| Wimbledon | 16 | 8 | 2.00 |
| Portsmouth | 15 | 7 | 2.14 |
| Wigan Athletic | 14 | 8 | 1.75 |
| Derby County | 13 | 7 | 1.86 |
| Charlton Athletic | 12 | 8 | 1.50 |
| Brighton & Hove Albion | 11 | 5 | 2.20 |
| Coventry City | 10 | 9 | 1.11 |
| Ipswich Town | 10 | 5 | 2.00 |
| Birmingham City | 9 | 7 | 1.29 |
| Bournemouth | 9 | 5 | 1.80 |
| Sheffield United | 7 | 5 | 1.40 |
| Sheffield Wednesday | 7 | 8 | 0.88 |
| Blackpool | 5 | 1 | 5.00 |
| Bradford City | 5 | 2 | 2.50 |
| Reading | 5 | 3 | 1.67 |
| Nottingham Forest | 4 | 5 | 0.80 |
| Oldham Athletic | 3 | 2 | 1.50 |
| Brentford | 2 | 2 | 1.00 |
| Huddersfield Town | 2 | 2 | 1.00 |
| Barnsley | 1 | 1 | 1.00 |
| Swindon Town | 1 | 1 | 1.00 |
Whilst Everton have conceded the most own goals of any team in the Premier League era, they were also ever-presents in it between its launch and the end of the 2021-2022 campaign. As a result, you might well argue that Aston Villa might be worse than them in terms of own goals conceded, considering the fact that the Birmingham club were in the top-flight for three years less than Everton. Both clubs regularly had to cope with relegation battles during the period of time in question, so the number of own goals conceded makes sense.
Interestingly, other clubs like Arsenal, Liverpool and Manchester United are all in the top ten of clubs for own goals, yet none of them have ever been relegated or even close to battling relegation. It suggests that longevity in the top-flight is just as key to conceding own goals as being a poor team fighting at the bottom of the table. It is certainly the case that teams like Fulham and Sunderland, which haven’t spent close to as many seasons in the Premier League as the top sides, are still up there because they’re so poor defensively.
When we look at the number of own goals conceded per season it is Blackpool who come out on top with five in their solitary Premier League Campaign. Hull City have conceded the most own goals per season of the teams to spend multiple spells in the top division, averaging 3.20 per season. Nottingham Forest have managed to hit the back of their own net the least, with 0.80 per season across five campaigns.
Of the teams to play in every Premier League season, Chelsea have had the lowest own goal rate of just 1.30 per season.
How Does The Premier League Compare To Other Divisions?
With the Premier League as a baseline, we can then look at other divisions in order to get a sense of where they sit in terms of own goals. Are more own goals scored in other divisions, or do the numbers seem to work across the board?
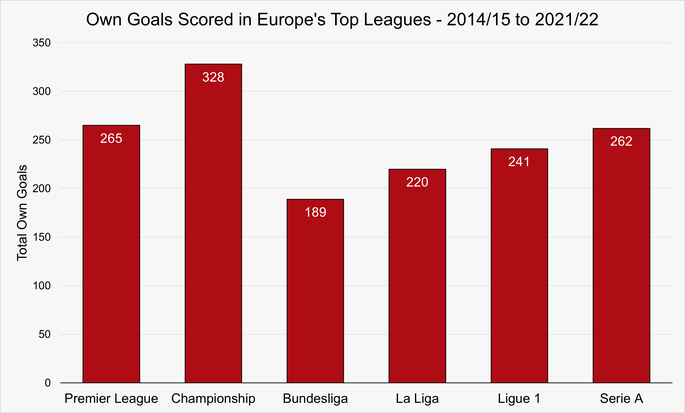
We can see that most own goals are scored in the EFL Championship, followed by the Premier League. The German Bundesliga has the fewest own goals scored across the eight season we looked at. Obviously different leagues play a different number of games, which is why it is more helpful to have a look at the percentage of the total goals scored during the course of a season to see where own goals sit compared to normal goals.
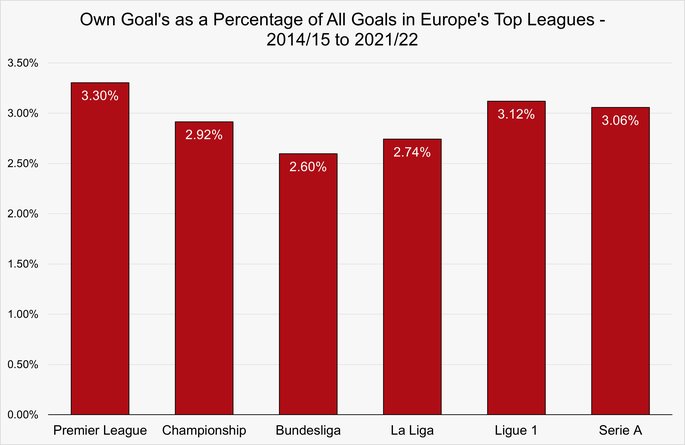
You can see then, that although the Championship has more own goals scored in general, but actually a lower percentage of them tend to be own goals. Of these divisions, the Premier League has the most own goals as a percentage of total goals in the eight seasons at 3.30%.
Germany is known as a country with defensively sound teams, and as with the Championship, the number of own goals scored in the Bundesliga is lower on average than in the Premier League when viewed as a percentage of the total goals scored during a season. In fact, the German top division has the fewest own goals of all the top five European Leagues and the EFL Championship.
We typically think of Spanish football as being one filled with flair and excitement. Is more attacking football generally a reason for more own goals? The data suggest that this isn’t the case with La Liga having the second fewest own goals as a percentage.
It is a bit of a cliché, but English people tend to think of the French top-flight as something of a ‘farmer’s league’. Does that show in the own goals scored? This is true to an extent with the second highest rate of own goals but this still falls below that of the Premier League.
Finally, Serie A in Italy is often thought of as being the most defensive in Europe. Does this have an impact on how many own goals are scored during a season? Although the rate of own goals are similar to the other leagues, they actually have the third highest percentage of own goals with the Championship, La Liga and Bundesliga having fewer as a total percentage.
Do the Different Leagues Follow the Same Trends?
Now that we’ve got the data from most of the big leagues across Europe, it is interesting to look at whether own goals tend to come in waves. That is to say, do all leagues tend to see a spike in own goals across seasons at the same time as each other, or is each league unique in how its own goals are scored?
Own Goal Rate Per Season Across Europe’s Top Leagues
| Season | Premier League | Championship | Bundesliga | La Liga | Ligue 1 | Serie A |
|---|---|---|---|---|---|---|
| 2014-2015 | 3.17% | 2.10% | 2.37% | 2.77% | 3.80% | 3.41% |
| 2015-2016 | 3.21% | 2.76% | 3.34% | 2.97% | 3.43% | 2.86% |
| 2016-2017 | 3.28% | 2.91% | 1.82% | 2.41% | 2.62% | 2.40% |
| 2017-2018 | 2.94% | 2.34% | 2.33% | 2.92% | 3.38% | 3.53% |
| 2018-2019 | 2.98% | 2.64% | 1.95% | 3.05% | 2.67% | 3.23% |
| 2019-2020 | 3.09% | 3.70% | 2.85% | 2.12% | 3.26% | 2.94% |
| 2020-2021 | 3.71% | 3.21% | 2.90% | 3.25% | 2.47% | 2.75% |
| 2021-2022 | 3.17% | 3.68% | 3.14% | 2.41% | 3.37% | 3.39% |
It is fair to say, then, that there isn’t a particularly obvious correlation between the percentage of own goals that are scored between the divisions. There does seem to be an occasional link in whether the number goes up or down from season to season, but it isn’t so marked as to mean that you could depend on the information when placing your bets. If there is an increase in own goals in the Premier League one season, that doesn’t necessarily mean that you will see an increase in them in La Liga, say.
What we can see, though, is that it is rare for the percentage of own goals scored to dip below 2%, given that that has happened just twice across the 48 league campaigns that we’ve looked at. Similarly, the number has never gone above 4%, so you can bear that in mind when looking at the number of own goals that have been scored at any particular point of a campaign. The likes of the Premier League’s own website is good for such information. If it’s below 2% heading into the final months of the season, you could perhaps expect a flurry of them, whilst close to 4% means there are unlikely to be many more.
Seasonal Own Goal Data
Whilst above we’ve collated the information that we have to give an idea of the main numbers and patterns when it comes to own goals, below we have a more comprehensive breakdown of the data per season.
Premier League Own Goals
| Season | Total Goals | Own Goals | Own Goal % |
|---|---|---|---|
| 2014-2015 | 975 | 31 | 3.17% |
| 2015-2016 | 1,026 | 33 | 3.21% |
| 2016-2017 | 1,064 | 35 | 3.28% |
| 2017-2018 | 1,018 | 30 | 2.94% |
| 2018-2019 | 1,072 | 32 | 2.98% |
| 2019-2020 | 1,034 | 32 | 3.09% |
| 2020-2021 | 1,024 | 38 | 3.71% |
| 2021-2022 | 1,071 | 34 | 3.17% |
Premier League Own Goals by Player Position
| Season | Goalkeepers | Defenders | Midfielders | Attackers |
|---|---|---|---|---|
| 2014-2015 | 1 | 22 | 6 | 2 |
| 2015-2016 | 3 | 25 | 2 | 3 |
| 2016-2017 | 5 | 22 | 6 | 2 |
| 2017-2018 | 4 | 23 | 1 | 2 |
| 2018-2019 | 0 | 27 | 3 | 2 |
| 2019-2020 | 4 | 20 | 6 | 2 |
| 2020-2021 | 3 | 26 | 7 | 2 |
| 2021-2022 | 4 | 24 | 4 | 2 |
EFL Championship Own Goals
| Season | Total Goals | Own Goals | Own Goal % |
|---|---|---|---|
| 2014-2015 | 1,474 | 31 | 2.10% |
| 2015-2016 | 1,337 | 37 | 2.76% |
| 2016-2017 | 1,441 | 42 | 2.91% |
| 2017-2018 | 1,409 | 33 | 2.34% |
| 2018-2019 | 1,473 | 39 | 2.64% |
| 2019-2020 | 1,457 | 54 | 3.70% |
| 2020-2021 | 1,274 | 41 | 3.21% |
| 2021-2022 | 1,385 | 51 | 3.68% |
German Bundesliga Own Goals
| Season | Total Goals | Own Goals | Own Goal % |
|---|---|---|---|
| 2014-2015 | 843 | 20 | 2.37% |
| 2015-2016 | 866 | 29 | 3.34% |
| 2016-2017 | 877 | 16 | 1.82% |
| 2017-2018 | 855 | 20 | 2.33% |
| 2018-2019 | 973 | 19 | 1.95% |
| 2019-2020 | 982 | 28 | 2.85% |
| 2020-2021 | 928 | 27 | 2.90% |
| 2021-2022 | 954 | 30 | 3.14% |
Spanish La Liga Own Goals
| Season | Total Goals | Own Goals | Own Goal % |
|---|---|---|---|
| 2014-2015 | 1,009 | 28 | 2.77% |
| 2015-2016 | 1,043 | 31 | 2.97% |
| 2016-2017 | 1,118 | 27 | 2.41% |
| 2017-2018 | 1,024 | 30 | 2.92% |
| 2018-2019 | 983 | 30 | 3.05% |
| 2019-2020 | 942 | 20 | 2.12% |
| 2020-2021 | 953 | 31 | 3.25% |
| 2021-2022 | 951 | 23 | 2.41% |
French Ligue 1 Own Goals
| Season | Total Goals | Own Goals | Own Goal % |
|---|---|---|---|
| 2014-2015 | 947 | 36 | 3.80% |
| 2015-2016 | 960 | 33 | 3.43% |
| 2016-2017 | 991 | 26 | 2.62% |
| 2017-2018 | 1,033 | 35 | 3.38% |
| 2018-2019 | 972 | 26 | 2.67% |
| 2019-2020 | 704 | 23 | 3.26% |
| 2020-2021 | 1,049 | 26 | 2.47% |
| 2021-2022 | 1,067 | 36 | 3.37% |
Italian Serie A Own Goals
| Season | Total Goals | Own Goals | Own Goal % |
|---|---|---|---|
| 2014-2015 | 1,024 | 35 | 3.41% |
| 2015-2016 | 979 | 28 | 2.86% |
| 2016-2017 | 1,123 | 27 | 2.40% |
| 2017-2018 | 1,017 | 36 | 3.53% |
| 2018-2019 | 1,019 | 33 | 3.23% |
| 2019-2020 | 1,154 | 34 | 2.94% |
| 2020-2021 | 1,163 | 32 | 2.75% |
| 2021-2022 | 1,089 | 37 | 3.39% |