 For football supporters, matches against the club’s biggest rivals matter that little bit more. When Arsenal welcome Tottenham Hotspur to the Emirates for the North London Derby, they do so in full knowledge that the outcome of the game can make or break the weekend of their fans. Whilst there are plenty of London clubs that go up against one another, the proximity of the Gunners and Spurs makes that match just a little bit more feisty. The question is, does it make much of a difference to the actual players?
Are teams more likely to be über competitive when one of their rivals come to town, or are they inclined to try to ease off a little bit in order to ensure that disaster doesn’t follow? The phrase ‘form goes out of the window in a derby’ is often used, but do the stats back up that feeling when you actually dig down into them? Football matches are, by their very nature, competitive, but does that competition spill over in any ways when it is a pair of fierce rivals that are taking to the pitch instead of two regular teams going at it for the points?
Picking Our Rivalries

Across the world of football, there are any number of extremely fierce rivalries that take place in professional football. If you were to head to South America, for example, there are some derbies that require an incredible police presence, such is the extent to which the teams taking part have very little love for each. In the United Kingdom, there are rivalries that appear ‘odd’ to those on the outside, such as when Crystal Palace and Brighton and Hove Albion come up against one another, but there are also more readily accepted rivalries.
One of the most bitter derbies in world football involves the two teams on Merseyside, with no love lost between Liverpool and Everton in spite of the fact that families are often split in half in terms of supporters. The same is true of Manchester United and Manchester City, with city-based rivalries always likely to involve the most excitement. In terms of success, no team in the country has enjoyed more if it than Liverpool, but Manchester United come in a close second, making matches between the teams tense affairs. Then there is the aforementioned North London Derby.
What Metrics We’ll Look At

Ultimately, there is something extremely subjective about the very notion of the question when it comes to whether football teams play different against their rivals. Even so, there are some things that we can look at that will give us a sense of whether there is something in the idea that teams put a bit more into matches when it matters more. The most obvious place to start is with fouls and cards, given that that suggests more aggression coming into play when a team is up against a rival side.
Next on the list is possession. Whilst some teams will always opt for a possession-based approach to games, others will be happy to sit back and try to hit the opposition on the counter. Does the amount of possession alter depending on whether a team is playing a rival? Also, what happens in terms of goals when rivals come up against one another? Do teams tend to be more attacking, or is it a matter of derbies tending to be close-run affairs that don’t see many goals because the teams concerned are way of giving things away?
The final aspect that we’ll consider is whether or not being at home or on the road makes a difference to any of these statistics. The reality is that supporters make a massive difference to the manner in which players approach games, which is why we’re even asking the question about whether teams play differently against rivals. The stats might look one way for a home match in such circumstances and a different way when in the opposition’s ground, largely because of how the home crowd is getting behind their team.
Setting a Baseline
Before we begin to look at the various teams and how they tend to play against their rivals, it is first worth establishing a baseline for each of them in terms of how they tend to perform in the various metrics that we’re going to be looking at. In order to do so, we’re going to have a look at our chosen metrics across five seasons and then use those seasons in order to work out an average. We can then go on to compare these averages to how they tend to do against the specific teams in question during each of the seasons.
Liverpool
The first team we’ll look at is Liverpool. It is worth bearing in mind that the Merseyside club was regularly challenging for the Premier League title during the period of time that we’re looking at, so their metrics are obviously much higher than if we looked at a different period in the competition’s history. In many ways, though, that is a helpful thing in the sense of letting us know whether things change markedly when coming up against a rival.
Liverpool’s Stats Per Game – 2017/18 to 2021/22
| Season | Fouls | Yellows | Reds | Possession | Scored | Conceded |
|---|---|---|---|---|---|---|
| 2021-2022 | 9.60 | 1.31 | 0.02 | 63.2% | 2.5 | 0.70 |
| 2020-2021 | 10.40 | 1.05 | 0.00 | 62.4% | 1.8 | 1.10 |
| 2019-2020 | 8.70 | 1.00 | 0.02 | 63.3% | 2.2 | 0.90 |
| 2018-2019 | 8.30 | 0.97 | 0.05 | 62.3% | 2.3 | 0.60 |
| 2017-2018 | 9.10 | 1.15 | 0.02 | 60.8% | 2.2 | 1.00 |
| Average | 9.22 | 1.10 | 0.02 | 62.4% | 2.2 | 0.86 |
Everton
Next up is a look at Liverpool’s Merseyside neighbour, Everton. The Blues have struggled to establish themselves in the top-half of the Premier League, instead regularly struggling at the bottom and often engaged in relegation battles. As with Liverpool’s success, though, this information is helpful in the sense that it can assist us in letting us know whether they tend to improve their performance when going up against their bitter rivals in a one-off match, or whether the seasonal average is what they always do.
Everton’s Stats Per Game – 2017/18 to 2021/22
| Season | Fouls | Yellows | Reds | Possession | Scored | Conceded |
|---|---|---|---|---|---|---|
| 2021-2022 | 9.70 | 2.05 | 0.15 | 39.7% | 1.10 | 1.70 |
| 2020-2021 | 10.20 | 1.55 | 0.05 | 46.4% | 1.20 | 1.30 |
| 2019-2020 | 12.40 | 1.84 | 0.07 | 49.2% | 1.20 | 1.50 |
| 2018-2019 | 11.40 | 1.44 | 0.10 | 51.7% | 1.40 | 1.20 |
| 2017-2018 | 12.10 | 1.34 | 0.07 | 45.5% | 1.20 | 1.50 |
| Average | 11.16 | 1.64 | 0.09 | 46.5% | 1.22 | 1.44 |
Manchester United
For a time, Manchester United were the team that everyone else would need to perform better than if they hoped to win the Premier League title. After the departure of Alex Ferguson, however, that changed and the Red Devils have struggled to put up any sort of consistency in the top-flight. Were they able to buck the trend against their fierce neighbours, or was it just more of the same? In order to know the answer to that question, it helps to have the following baseline of information for us to work with and be able to compare:
Manchester United’s Stats Per Game – 2017/18 to 2021/22
| Season | Fouls | Yellows | Reds | Possession | Scored | Conceded |
|---|---|---|---|---|---|---|
| 2021-2022 | 10.40 | 1.97 | 0.05 | 52.7% | 1.50 | 1.50 |
| 2020-2021 | 11.90 | 1.68 | 0.02 | 55.8% | 1.90 | 1.20 |
| 2019-2020 | 11.10 | 1.92 | 0.00 | 56.0% | 1.70 | 0.90 |
| 2018-2019 | 11.40 | 1.92 | 0.10 | 54.8% | 1.70 | 1.40 |
| 2017-2018 | 10.70 | 1.68 | 0.02 | 54.8% | 1.80 | 0.70 |
| Average | 11.10 | 1.83 | 0.04 | 54.8% | 1.72 | 1.14 |
Manchester City
In the period of time that we’re looking at, Pep Guardiola’s Manchester City were imperious in the Premier League. Though allegations around financial misconduct would later emerge, there is no questioning the fact that they were easily the team to beat and during the period of time in question only Liverpool managed to beat them to the league title. How did the Citizens tend to get on in most matches that they performed in? That is the question that we’re looking to answer here, with the following being their performances across the five seasons we’re looking at:
Manchester City’s Stats Per Game – 2017/18 to 2021/22
| Season | Fouls | Yellows | Reds | Possession | Scored | Conceded |
|---|---|---|---|---|---|---|
| 2021-2022 | 8.40 | 1.10 | 0.02 | 68.3% | 2.60 | 0.70 |
| 2020-2021 | 9.50 | 1.21 | 0.05 | 63.7% | 2.20 | 0.80 |
| 2019-2020 | 9.50 | 1.57 | 0.10 | 66.7% | 2.70 | 0.90 |
| 2018-2019 | 8.60 | 1.15 | 0.02 | 68.3% | 2.50 | 0.60 |
| 2017-2018 | 9.10 | 1.55 | 0.05 | 71.8% | 2.80 | 0.70 |
| Average | 9.02 | 1.32 | 0.05 | 67.8% | 2.56 | 0.74 |
Tottenham Hotspur
When it comes to Tottenham Hotspur, few teams are as strange in the English top-flight. The North London club have regularly bumped around the top four, but have rarely put up any sort of genuine tile challenge and have not been able to get to the same sort of heights that the likes of Manchester City and Liverpool have established. They also haven’t enjoyed the consistency of manager as the others have, bringing in various people to try to replace Mauricio Pochettino. Here is a look at their average stats across our five seasons in question:
Tottenham Hotspur’s Stats Per Game – 2017/18 to 2021/22
| Season | Fouls | Yellows | Reds | Possession | Scored | Conceded |
|---|---|---|---|---|---|---|
| 2021-2022 | 10.20 | 1.76 | 0.02 | 51.9% | 1.80 | 1.10 |
| 2020-2021 | 11.60 | 1.39 | 0.05 | 51.6% | 1.80 | 1.20 |
| 2019-2020 | 11.10 | 2.15 | 0.05 | 52.1% | 1.60 | 1.20 |
| 2018-2019 | 9.90 | 1.47 | 0.07 | 59.3% | 1.80 | 1.00 |
| 2017-2018 | 10.10 | 1.31 | 0.05 | 62.1% | 1.90 | 0.90 |
| Average | 10.58 | 1.62 | 0.05 | 55.4% | 1.78 | 1.08 |
Arsenal
Last but by no means least come the Gunners. The other team in North London were a force to be reckoned with under Arsene Wenger, but when the Frenchman departed the club there was a general feeling that things would only go downhill from there. That proved to be the case and Arsenal, like their city rivals, worked with numerous different managers before Mikel Arteta was able to settle into the job and re-establish his former side as one that could genuinely ask questions of the established clubs. Here is what the averages look like for the Gunners across our five seasons:
Arsenal’s Stats Per Game – 2017/18 to 2021/22
| Season | Fouls | Yellows | Reds | Possession | Scored | Conceded |
|---|---|---|---|---|---|---|
| 2021-2022 | 9.60 | 1.57 | 0.10 | 53.3% | 1.60 | 1.30 |
| 2020-2021 | 9.10 | 1.23 | 0.13 | 53.7% | 1.40 | 1.00 |
| 2019-2020 | 11.10 | 2.26 | 0.13 | 53.9% | 1.50 | 1.30 |
| 2018-2019 | 10.80 | 1.89 | 0.05 | 58.4% | 1.90 | 1.30 |
| 2017-2018 | 10.10 | 1.50 | 0.05 | 61.8% | 1.90 | 1.30 |
| Average | 10.14 | 1.69 | 0.09 | 56.2% | 1.66 | 1.24 |
Liverpool v Everton
The first rivalry that we’ll look at is the Merseyside Derby. In many ways, this is the most unfair comparison because of the difference between the two teams. At the time of writing, Everton have only won at Anfield once since 1999 and that was when no supporters were in the ground to see it. The Blue team from the city has also failed to win a single trophy since 1995, whilst the Reds have won every trophy that there is to win in club football.
Even so, here is a look at the five seasons we’ve focussed on, alongside whether the performance in each metric was higher or lower than their average for that season, looking at the performances at the two grounds:
Anfield
How did things pan out for both teams when they were playing at Anfield, Liverpool’s home ground?
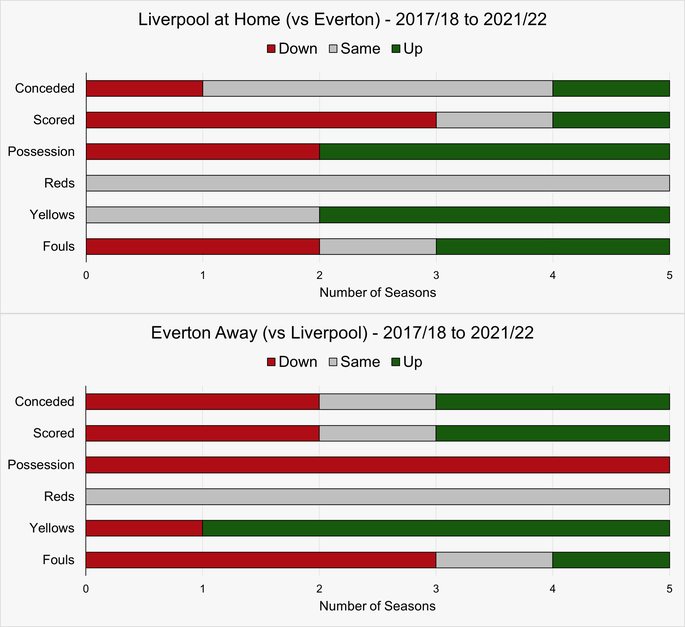
Whilst the information that we have here is mixed, there is certainly a suggestion that Liverpool play differently when up against their city rivals. It seems as though they try to keep the number of cards that they receive relatively similar, perhaps suggesting less aggression. For Everton, they seem to be happy enough to cede far more possession to Liverpool than on average across the league season. Interestingly, the number of fouls committed is mostly down, suggestive of a team not being too riled by the crowd.
Goodison Park
Do Everton tend to perform much differently when they’re being bayed on by the home crowd? Here’s a look at how they’ve performed against Liverpool at Goodison Park:
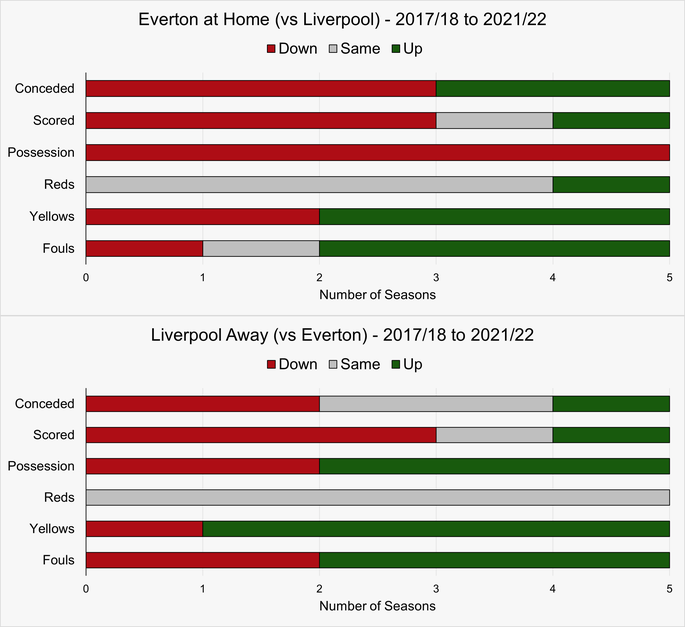
The data seems to suggest that Liverpool are slightly more aggressive at Goodison Park, committing more fouls than is usual. On the whole, the number of goals that the score is also down, which gives the idea that Everton do well to keep them out. The Blues are, perhaps unsurprisingly, more likely to commit fouls at Goodison Park when Liverpool visit than across the rest of the season. The rest of the metrics suggest that they just want to make it something of a nothing game if they can.
Liverpool v Manchester United
We will stick with Liverpool for another of their fierce rivalries, this time against Manchester United. The two clubs are the most successful in the history of English football, with the Merseyside club ahead of their Mancunian rivals on total major trophies won at the time of writing, though the Red Devils edge league titles. In that sense, this fixture is probably the fairest of all in terms of being able to judge whether or not teams tend to play differently when they face their rivals, on account of the fact that they are relatively evenly matched across a long period of time.
Anfield
As with against Everton, we will start by looking at how Liverpool get on at their own home when the Red Devils come to town:
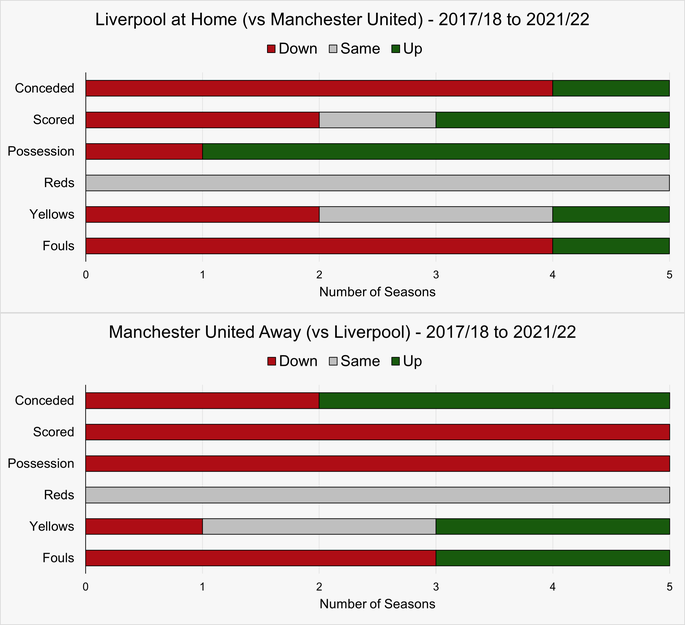
When it comes to Performances at Anfield, Liverpool tend to do better against Manchester United in most metrics, especially in the later seasons. Fouls committed being down in four out of the five campaigns suggests more control over their play. When it comes to Manchester United, they have significantly less possession when they play Liverpool at Anfield than they do across the rest of the season on average. There are varying levels of aggression from one campaign to the next.
Old Trafford
What about when Liverpool head to the ‘Theatre of Dreams’? Do things happen differently there?
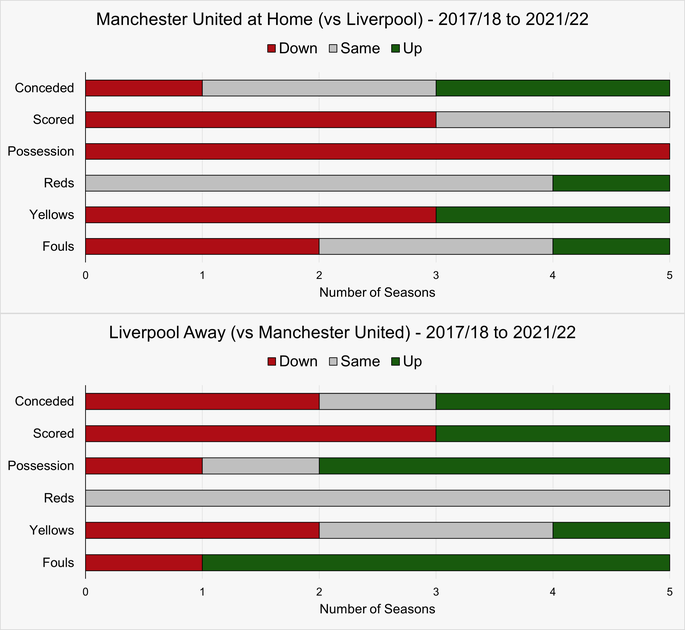
In all but one of the seasons at Old Trafford, the number of fouls committed by Liverpool are up. There isn’t a significant difference in the number of cards received, but it is definitely suggestive of a team that is looking to impose itself on the game more. When it comes to United, the Red Devils once again cede possession a lot more than they do during the rest of the season, with the other metrics suggesting there is definitely a different style of play going on.
Manchester United v Manchester City
Alex Ferguson once referred to Manchester City as the ‘noisy neighbours’, giving a sense of the sort of rivalry that these two teams have enjoyed over the years. When the Red Devils were dominating English football, the Citizens struggled to even stay in the English top-flight. Then the Etihad-based club was taken over by Sheikh Mansour and there was a power-shift in Manchester, which wasn’t helped from a United point of view by the retirement of Ferguson. How does the rivalry work out in terms of our metrics?
Old Trafford
We will start out exploration of the two teams and how they play at Old Trafford, the home ground of Manchester United:
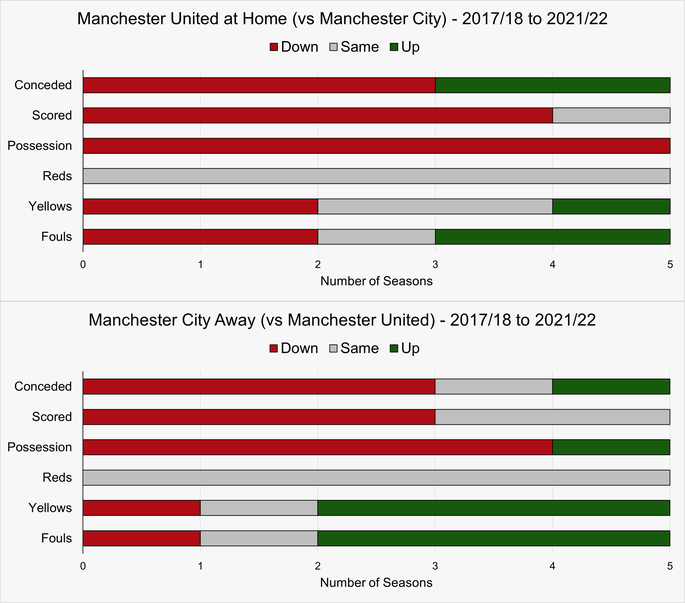
It seems clear that Manchester United are happy to cede possession against teams that are ‘better’ than them, as Liverpool and Manchester City have been in recent history. Whether they are more or less aggressive depends on the season. For City, they actually tend to have less possession against United at Old Trafford than they are used to in most of their other games. In general, their metrics are not consistent, suggesting that they play differently against their neighbours, even if it isn’t always something that works for them.
Etihad Stadium
How do Manchester United get on when they visit the home of their ‘noisy neighbours’? Do the metrics look any different?
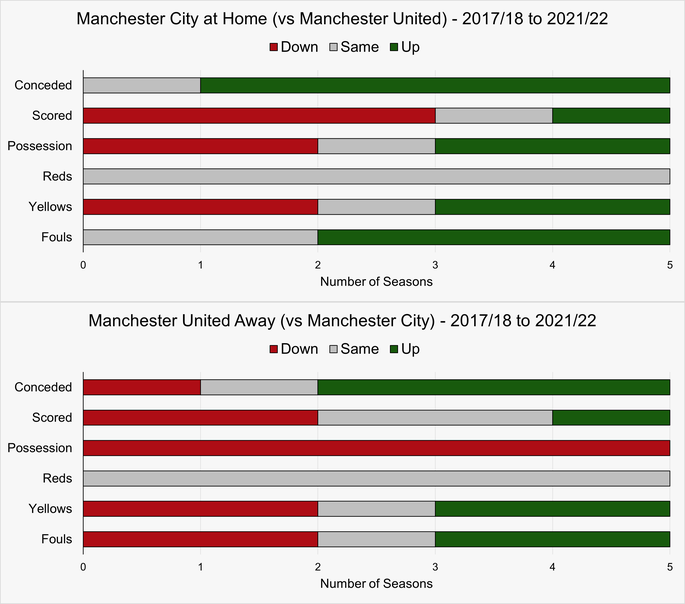
The sense of Manchester United ceding possession continues at the Etihad, but the results show that it isn’t always the worst idea. The Red Devils definitely play differently against their neighbours, but it isn’t always a bad thing. It is probably fair to say that the opposite is true for City, who generally have more possession but are also more aggressive. They can’t quite seem to keep their heads straight when they play United and that is borne out in the results across these few seasons.
Arsenal v Tottenham Hotspur
Given the sheer amount of clubs based in the capital, you would think that there would be fierce derbies all over the place. In reality, however, most of the clubs dislike each other and want to win, but few have the sheer animosity towards each other that is shared between Arsenal and Tottenham Hotspur. That is largely because Spurs feel as though the Gunners moved into their part of town, creating the rivalry that is known as the North London Derby. How do the two teams perform when they come up against one another?
Emirates Stadium
We will look at the performances of both teams at the Emirates firstly. Did Arsenal playing at home make much of a difference to the metrics that we’re looking at?
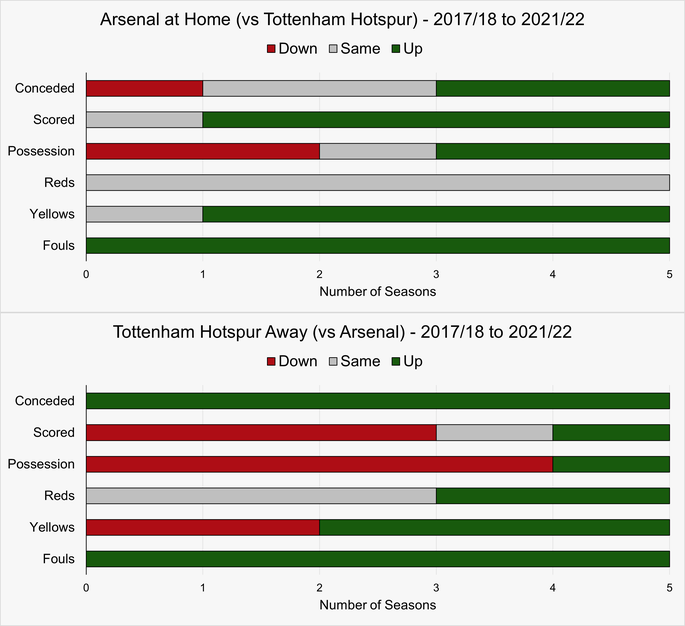
The first thing that is worth noting is that the North London Derby is a lot more aggressive than all of the other fixtures, with the number of red cards being the clear metric to look at on that front. For Spurs, they have clearly enjoyed some visits to the Emirates more than others. Arsenal, though, tend to like playing at home more often than not.
Tottenham Hotspur Stadium & Wembley Stadium
Tottenham moved out of White Hart Lane in May of 2017, playing some of their home matches at Wembley stadium as a result. In 2019, they moved into the Tottenham Hotspur Stadium and have remained there since. That is worth bearing in mind when looking at the metrics of how the two teams played when Spurs were technically the ‘home’ team.
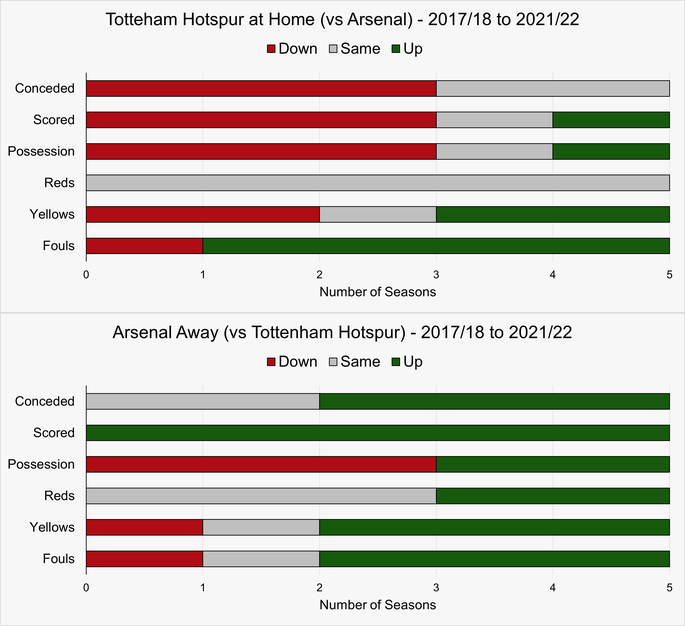
The red card metric continues to be the major difference, even when the North London Derby is played away from the Emirates. The two teams tend to be more aggressive than their seasonal averages would suggest they should be. Spurs have had some joy against their rivals, with the Gunners giving as good as they get.
Do Teams Play Differently in Derbies?
Looking at the data that we have available across a number of metrics, it is clear that teams definitely play differently against their rivals than they do when they face the rest of the division. It isn’t a uniform thing where one metics is always up or one always down, but it is certainly the case that there aren’t as many that are the same as the league average across the seasons. With that in mind, it is worth considering how a team tends to be affected when they know it is a rival that they’re coming up against.