 The competitive nature of football is such that players are always likely to go into challenges more strongly than is appropriate in the eyes of the officials. Add to that the instinctive things that we would probably all do in the same situation, such as throwing our hand out to block the ball when it’s close to our body, and it’s easy to understand why players get booked on a relatively regular basis. There are many different regulations that players can find themselves on the wrong side of to get a booking, so how can we take advantage?
As you might imagine, you can place all sorts of bets when it comes to footballers and their disciplinary actions. You can place a bet on the first player to be shown a card, for example, as well as wagers on players that you think will be booked or sent off during the course of a match. When it comes to betting on the total number of players to get on the wrong side of a referee, the standard bet that you can place is one on the Booking Points awarded by the man in the middle during the 90 minutes, so we’ll explain what they are and how to take advantage here.
Quick Answer: How Many Cards and Booking Points Are There in the Average Premier League Match?
In the five Premier League seasons between 2016-17 and 2020-21, there was an average of 3.24 yellow cards shown per game, with a red card every 8.33 matches.
When it comes to booking points, the average for the Premier League in these five seasons was 34.84 points per game.
What Are Booking Points?

In order to give people the ability to place a bet on cards issued during matches, bookmakers came up with the system of assigning point values to yellow and red cards. The current system for points is as follows:
- Yellow Card = 10 Points
- Red Card = 25 Points
- Two Yellows Making A Red = 35 Points
The interesting one in that list is the red card awarded for two bookable offences, which is worth 35 points rather than the 45 points that you might assume it would be.
Betting On Booking Points
Most bookmakers use Booking Points by offering an Over / Under market. The market is then broken down into brackets, which will differ from bookmaker to bookmaker and even from match to match. As an example, here’s the Booking Points bracket offered by one bookie at the time of writing:
- Under 40 Points
- Exactly 40 Points
- Over 40 Points
Some bookmakers might move the brackets slightly and have something like 0-20, 21-40 and 41+, so it’s always worth looking at the bookmaker that you want to bet with and their specific rules. Just because the brackets have worked one way with a certain bookie doesn’t mean that it will be the same the next time you go to bet with them and will almost certainly be different if you bet with a different company in the future. Looking this up is arguably more important than the research you can do into booking points in general.
How Many Cards Fit Into Each Bracket
If we assume for a moment that the the bookie that you’re looking to place your bets with boasts the brackets of Under 40, Exactly 40 and Over 40, that would mean the following breakdown of potential cards issued:
| Bracket | Possible Cards |
|---|---|
| Under 40 Points | Up to 3 yellow cards or one red card and one yellow |
| Exactly 40 Points | Precisely 4 yellow cards |
| Over 40 Points | At least 5 yellow cards or one red card and two yellows |
Of course, if the bookmaker that you place your bets with was a little bit less generous than that and the bracket was 0 – 20 Points, 21 – 40 Points and 41+ Points then the breakdown would look more like this:
| Bracket | Possible Cards |
|---|---|
| 0 – 20 Points | 2 yellow cards maximum, no red cards |
| 21 – 40 Points | Three or four yellow cards with no reds, a red card, a red card and a yellow card |
| 41+ Points | At least 5 yellow cards or one red card and two yellows |
As you can see, only the final bracket remains the same for both cases. In short, the number of points will dictate how many cards you need to be shown by the match referee in order for your bet to be a winning one. Some bookmakers might not cover brackets in that way and instead cover booking point markets by asking you how many points you think there’ll be in total, with the following being an example of possible options for you to choose from: Over 20 Points, Over 30 Points, Over 40 Points and so on up to Over 90 Points.
It goes without saying that each of those brackets will have their own number of cards associated in order for them to be winners. Indeed, fewer than 20 points would probably be one of the most unlikely outcomes that you could expect to happen, depending on the match that you were watching.
How May Cards Are Shown in the Premier League?
The Premier League is one of the most exciting divisions of football in all of Europe. That plays out in the number of cards issued to teams just as much as the amount of goals scored, which can be demonstrated by looking at the number of yellow and red cards shown to teams during a top-flight season. Here’s a look back at the five seasons between 2016-17 and 2020-21, starting with the number of yellow cards shown.
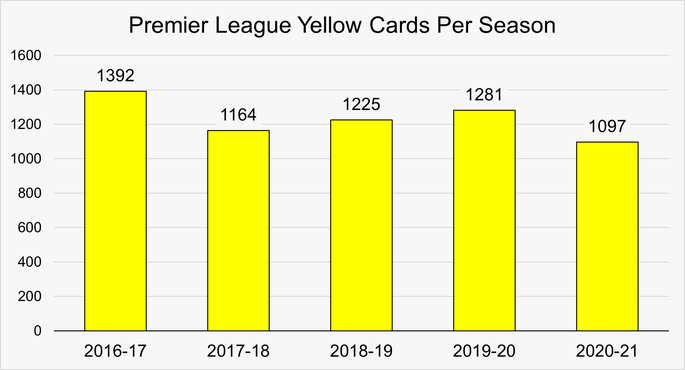
We can see that there was a total of 6,159 yellow cards handed across the five seasons with a high of 1392 yellows in the 2016-17 season and a low of 1097 in the 2020-21 season. Now lets take a look at the red cards awarded across this same period.
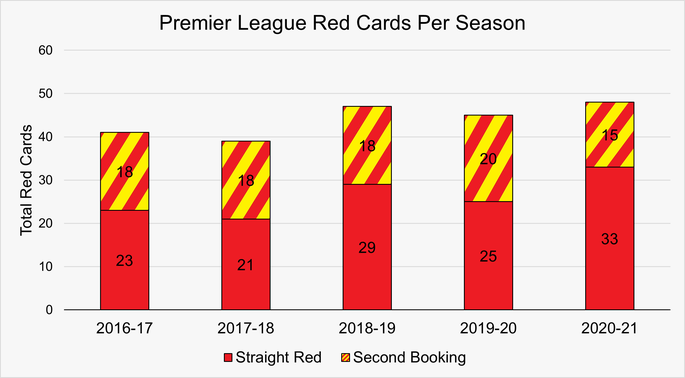
There were a total of 220 red cards shown in this five season period, split between 131 straight reds and 89 as a result of being shown a second yellow card in a match. Having had the fewest yellows, the 2020-21 season had the most reds across the five seasons in question with 48. The lowest number awarded was 39 in the 2017-18 season.
Average Premier League Cards Shown Per Game
| Season | Yellow Cards | Red Cards |
|---|---|---|
| 2020-2021 | 2.89 | 0.13 |
| 2019-2020 | 3.37 | 0.12 |
| 2018-2019 | 3.22 | 0.12 |
| 2017-2018 | 3.06 | 0.10 |
| 2016-2017 | 3.66 | 0.11 |
| All 5 Seasons | 3.24 | 0.12 |
When we analyse the figures in the table above, we can see that there are just over three yellow cards shown on average per game in the Premier League. As for red cards, there’s an average of 0.12 cards shown per game, or roughly one red card shown every 8 games.
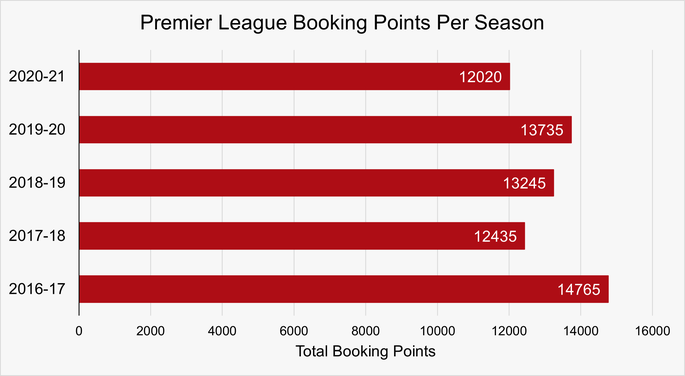
Premier League Booking Points
Now that we know how many cards have been shown to teams in the Premier League, we can calculate how many bookings points have been racked up. The chart below shows the total points accumulated across the league in the five seasons between 2016-17 and 2020-21.
With 380 games played each season, we can then calculate the average number of booking points per game in each of these seasons.
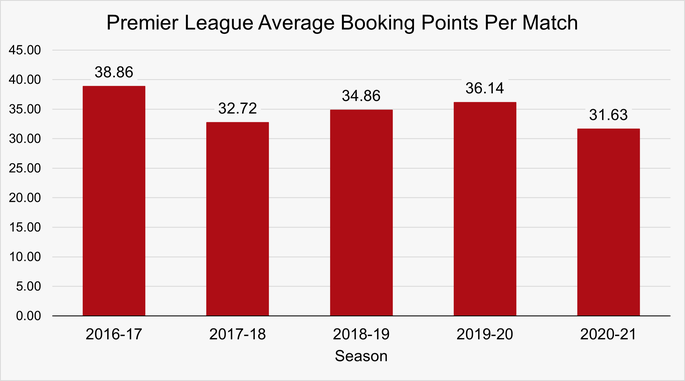
As you can see, the averages are fairly consistent across the five campaigns, with a high of 38.86 booking points per game in 2016-17 and a low of 31.63 booking points per game in the 2020-21 season. It’s worth noting that the majority of the 2020-21 campaign took place in stadiums without fans. That obviously suggests that crowds being in the ground do make some difference, but not necessarily enough to make a huge difference.
Across all five of these seasons the average booking points per game was just under 35 points at 34.84. That said, the booking points in a match will range from the low numbers in a placid end of season dead rubber to a card happy referee in a fierce local derby so it’s worth doing some homework before placing your wagers. Regardless, in terms of the bets that you might wish to place, a bookmaker offering markets of 21-40 Booking Points per game is one that you’ll want to consider placing your wagers with on avarage.