 When you’re watching the Premier League, it’s easy to get caught up in the sales pitch for it as the most exciting league in the world. When the commentator screeches ‘And it’s live!’ before every match in tones that suggest you’d be mad to watch anything else, it’s not unusual to then be expecting a thrill-ride during the actual game. That the same commentator then sounds as if he’s describing a funeral for the following ninety minutes shows us the lie on that front.
Virtually every country in the world has a football league, with many having multiple division. Whilst it would be useful to know what the most common score in any level of football match is, it isn’t all that practical. Aside from a difficulty in collating the information, most people are unlikely to care what happens in Azerbaijani Second Division games. Instead, it’s useful to focus on the most popular English divisions, which are the Premier League and the Championship.
It’s easy to imagine that goals fly in left, right and centre during football matches, simply because they’re the things that we remember. It isn’t necessarily true, with at least one of the sides likely to have a zero next to their name when games reach their conclusion. Even so, there is excellent value to be found in betting on the correct scoreline in football matches, so which Correct Score bet would earn you the most money if you bet on it throughout a season?
Quick Answer: What is the Most Common Football Score?
The most common scoreline is 1-0 for either side, with over 16% of Premier League games and more than 18% of Championship games ending with a one-nil victory. Home advantage plays an important role, with the most frequent exact correct score a 1-0 home victory, which occurs in around 10% of matches.
Most Common Premier League & Championship Scores

By Daniel, flickr
We’ve decided to look at five seasons between 2015/16 and 2019/20. We wanted to know if some scorelines occurred far more frequently during that time than others, which in turn would give us an idea about what the best bet to place on Premier League and Championship correct score markets could be.
We know from our introduction that the most common score line is a 1-0 victory, but how often do certain score lines tend to occur? We know that 6-2 isn’t exactly a score line that you’ll see very often, but the likes of 2-2, 0-0 and so on seem to crop up on a far more regular basis than one might expect. The question, of course, is just how regularly do they really happen. Do we tend to remember them because they’re interesting scores or they occur a lot?
We have collated the correct scores from the past five Premier League and Championship seasons to see what percentage of matches finish at certain scorelines. In order to make this easier, we’ve put home and away results together so sometimes a match will have finished 1-0 and other times 0-1. We’ll break down the home and away information into more detail later on and we break down the most frequent scores season by season in the next section.
Most Common Scores – 2015/16 to 2019/20
| Score | Premier League | Championship | Combined | |||
|---|---|---|---|---|---|---|
| Frequency | % of Games | Frequency | % of Games | Frequency | % of Games | |
| 0-0 | 134 | 7.05% | 211 | 7.64% | 345 | 7.40% |
| 1-0 | 306 | 16.10% | 515 | 18.65% | 821 | 17.61% |
| 1-1 | 205 | 10.78% | 358 | 12.97% | 563 | 12.08% |
| 2-0 | 205 | 10.78% | 338 | 12.24% | 543 | 11.65% |
| 2-1 | 287 | 15.10% | 465 | 16.84% | 752 | 16.13% |
| 2-2 | 100 | 5.26% | 165 | 5.97% | 265 | 5.68% |
| 3-0 | 139 | 7.31% | 172 | 6.23% | 311 | 6.67% |
| 3-1 | 149 | 7.84% | 171 | 6.19% | 320 | 6.86% |
| 3-2 | 76 | 4.00% | 122 | 4.42% | 198 | 4.24% |
| 3-3 | 14 | 0.73% | 23 | 0.83% | 37 | 0.79% |
| 4-0 | 72 | 3.78% | 54 | 1.95% | 126 | 2.70% |
As the table confirms, the 1-0 scoreline occurred in 306 Premier League games and 515 Championship games across those five seasons, more than any other correct score and in 17.6% of all matches in those two divisions. The next most popular scoreline was 2-1 which occurred in 752 matches in both leagues.
Most Frequent Scorelines by Season
In this table we’ll look at how many times a specific score line was the most frequent full-time result in the English top-flight and the second-tier of football for each of the five seasons in question. Does the most frequent correct score vary each season?
Most Common Scores by Season
| Season | Premier League | Championship | ||||
|---|---|---|---|---|---|---|
| Score | Frequency | % of Games | Score | Frequency | % of Games | |
| 2015/16 | 1-0 | 70 | 18.42% | 2-1 | 102 | 18.48% |
| 2016/17 | 1-0 | 59 | 15.53% | 1-0 | 110 | 19.93% |
| 2017/18 | 1-0 | 67 | 17.63% | 1-0 | 99 | 17.93% |
| 2018/19 | 2-0 | 67 | 17.62% | 1-0 | 99 | 17.93% |
| 2019/20 | 2-1 | 62 | 16.32% | 1-0 | 114 | 20.65% |
| Total (5 Seasons) | 1-0 | 306 | 16.11% | 1-0 | 515 | 18.66% |
So what does the above table tell us? Well, 0-0 might not be the most popular score line ever, but it’s not outrageous to suggest that low-scoring games are the most common ones in England’s top two divisions. A 1-0 win was the most common score on 3 out 5 Premier League seasons and 4 out 5 Championship seasons between 2015/16 and 2019/20. This was the correct score on 821 occasions across those five seasons, given that there were 4660 during that time it means that roughly 1 match in every 6 or so finished 1-0.
As we mention above, 2-1 is the second most frequent scoreline and indeed in the 2015/16 Championship season and the 2019/20 Premier League season, this was the most popular scoreline of all.
Perhaps surprisingly, a 2-0 final score occurred more often than any other in the 2018/19 Premier League campaign. Arsenal alone won over 30% of their home games 2-0 that season, 2-0 to the Arsenal anyone?
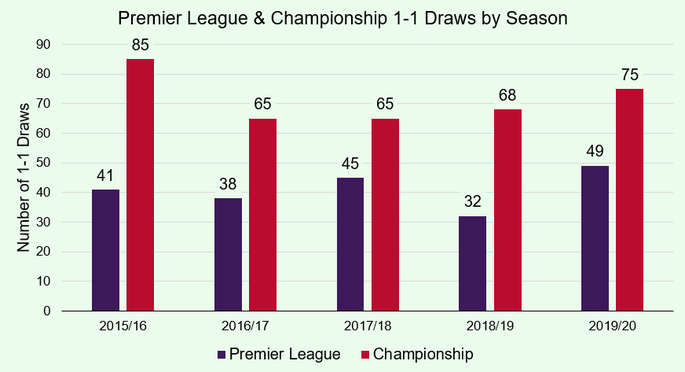
Most Frequent Draws by Season
The most common drawn scoreline in each of the five seasons between 2015/16 and 2019/20 is 1-1. There were 563 Premier League and Championship 1-1 draws in that time, though there has been quite a high degree of variation between each season.
If you fancy betting on a draw therefore, you’re seemingly best off going for one that ends with both teams scoring as opposed to a goalless encounter.
We’ve written about the prevalence of draws, and goalless draws, specifically in our article on drawn matches.
Home vs Away
The main thing to remember is that the above score lines don’t separate out home and away results. That is to say, some of them will have finished 1-0 and others will have finished 0-1, presuming that you always put the home team’s score first when expressed in that manner.
The obvious follow-up question is whether the most common score lines differ depending on whether you’re looking at home or away results. Is it more likely that a team will win 1-0 if they’re at home, or is another score line more common when you break things down like that?
One thing that’s worth noting immediately is that draws have not been included in the home versus away analysis. Technically draws are a result for both the home team and the away side, so they’re difficult to include them into that comparison.
Home & Away Correct Scores – 2015/16 to 2019/20
| Score | Premier League | Championship | ||
|---|---|---|---|---|
| Home | Away | Home | Away | |
| 1-0 | 181 (9.53%) | 125 (6.58%) | 296 (10.72%) | 219 (7.93%) |
| 2-0 | 163 (8.58%) | 89 (4.68%) | 203 (7.36%) | 135 (4.89%) |
| 2-1 | 153 (8.05%) | 134 (7.05%) | 266 (9.64%) | 199 (7.21%) |
| 3-0 | 83 (4.37%) | 56 (2.95%) | 114 (4.13%) | 58 (2.10%) |
| 3-1 | 95 (5.00%) | 54 (2.84%) | 97 (3.51%) | 74 (2.68%) |
| 3-2 | 41 (2.16%) | 35 (1.84%) | 75 (2.72%) | 47 (1.70%) |
| 4-0 | 47 (2.47) | 25 (1.32%) | 38 (1.38%) | 16 (0.58%) |
There’s plenty of interesting stuff to learn from this table. Clearly there is a home advantage with each of the victories more likely at home rather than away. The discrepancy is least however with 2-1 and 3-2 scorelines, i.e. both teams scoring with a one goal margin of victory.
In the Premier League, the most common exact score is a 1-0 home win, followed by a 2-0 home win and then a 2-1 home win. The away wins then come next but notably a 2-1 away win is more common that 1-0.
The Championship also has a 1-0 home win as the most prevalent score, though the second most frequent is a 2-1 home win followed by 2-0, before a 1-0 away win the fourth most likely.
The Most Frequent Home & Away Scores by Season
Another question we can ask is how the most popular score information by season alters when you start looking at the results for the home side compared to the away side. We’ll do exactly that now, again removing draws from the analysis table as they are shared result between both teams and we therefore don’t learn if there is a bias either way. Here’s a look at the Premier League’s most popular home and away scores between 2015/16 and 2019/20:
Premier League
| Season | Home | Away | ||||
|---|---|---|---|---|---|---|
| Score | Frequency | % of Games | Score | Frequency | % of Games | |
| 2015/16 | 1-0 | 37 | 19.47% | 0-1 | 33 | 17.37% |
| 2016/17 | 1-0 | 38 | 20.00% | 1-2 | 24 | 12.63% |
| 2017/18 | 1-0 | 44 | 23.16% | 1-2 | 24 | 12.63% |
| 2018/19 | 2-0 | 44 | 23.16% | 1-2 | 33 | 17.37% |
| 2019/20 | 2-1 | 37 | 19.47% | 0-2 / 1-2 | 25 | 13.16% |
In the 2015/16 1-0 is both the most popular home result and the most popular away result and the split is pretty even. In this example, the scoreline in the Premier League finished 1-0 to the home side thirty-seven times and 0-1 to the away team thirty-three times. We can see however that it was in fact 2-1 that occurred more often in away games in the three seasons between 2016/17 and 2018/19 and joint most popular in the 2019/20 season.
Next up the Championship, again in the five seasons between 2015/16 and 2019/20:
Championship
| Season | Home | Away | ||||
|---|---|---|---|---|---|---|
| Score | Frequency | % of Games | Score | Frequency | % of Games | |
| 2015/16 | 1-0 | 58 | 21.01% | 1-2 | 45 | 16.30% |
| 2016/17 | 1-0 | 63 | 22.83% | 0-1 | 47 | 17.03% |
| 2017/18 | 1-0 | 57 | 20.65% | 0-1 | 42 | 15.22% |
| 2018/19 | 1-0 | 55 | 19.93% | 0-1 | 44 | 15.94 |
| 2019/20 | 1-0 | 63 | 22.83% | 1-2 | 36 | 13.04% |
Here we can see much more consistency for that most popular 1-0 score for both the home and away results, where it was most frequent for both in the three seasons between 2016/17 and 2018/19. A 2-1 away win pipped 1-0 for popularity for the traveling side in 2015/16 and 2019/20 however.
Overall, it seems that visiting Premier League teams have to work that bit harder for victory, with the home side scoring more often and requiring a second from the guests to seal an away win.