 It is something of a cliché to say that football is a game of two halves, yet that is very literally the case. Matches are made up of two periods of 45 minutes, with the possibility of extra-time and even penalties if games haven’t been decided by the time that the 90 minutes are up, depending on the competition. Elsewhere on this site you can read about how important the first goal in a match can be, but when it comes to In-Play betting is always helpful to know what the stats say about when the most goals are scored in a game.
After all, if you’re watching a match and two goes have been scored in the first-half, does that mean that, statistically, you’re unlikely to see many more goals scored before the full-time whistle is blown? Or can the second-half still be a goal-fest, depending on the teams that are playing and the number of times the ball has hit the back of the net already? They’re the sorts of questions you’ll want to ask yourself before looking to place a bet, to say nothing of markets that ask which half will see the most goals scored.
What Half Has the Most Goals Scored?
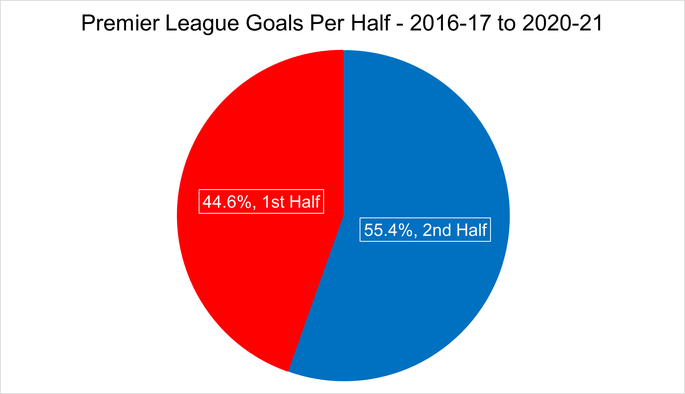
In the five seasons between 2016-17 and 2020-21 in the Premier League, Championship, League One and League Two, 55.7% of goals scored came in the 2nd half compared to 44.3% in the 1st half. There were a total of 11,415 first half goals scored across these five seasons, compared to 14,354 goals in the second half, a difference of 2,949 goals.
All four divisions had more 2nd half goals than 1st but the highest percentage of 2nd half goals came in the Championship with 56.6%. The Premier League, League One and League Two all had 55.4% of goals scored coming in the second period.
Premier League
In order to get our head around what the stats say, it is worth having a look at the English top-flight. The Premier League is considered to be one of the most exciting leagues in world football, so you would imagine that there are goals galore being scored throughout matches. Whilst there are obviously sometimes matches that end 0-0, that doesn’t necessarily mean that those matches are boring. It does mean that they’re irrelevant as far as this article is concerned, so we’ll ignore them here.
What we will look at is how many goals were scored in the first-half compared to how many were scored in the second-half of matches across five seasons of Premier League football. In both instances, we’ll also add what percentage of the total goals scored that amounts to. The seasons we’ve looked at were those between 2016-2017 and 2020-2021:
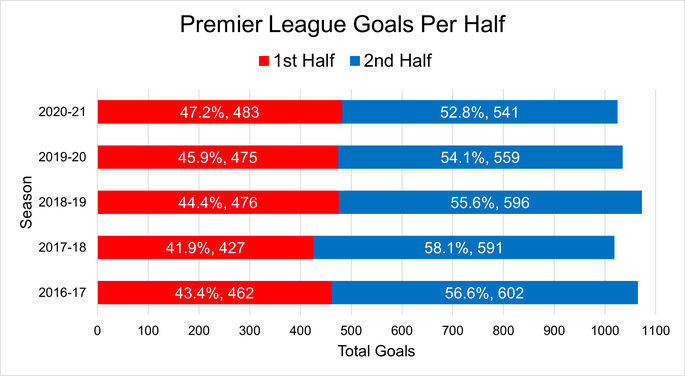
It is pretty clear that more goals are scored in the second-half of Premier League matches, with that being the case across all five seasons that we’ve looked at.
In all but two of the campaigns that we investigated, more than 100 additional goals were scored during the second period of matches. It is also interesting to note that the overall number of goals is what makes the difference in terms of the percentage of goals scored, as we can identify by looking at the 2018-2019 and 2019-2020 seasons.
What we mean by that is the in the 2018-2019 campaign, 476 goals were scored in the first-half of matches. A season later and that had dropped to 475, meaning just one goal less was scored, yet the percentage of total goals scored in the first-half was 44.40% in 2018-2019 and had increased to 45.94% in 2019-2020. In other words, fewer goals were scored but the percentage share of first-half goals actually increased. Regardless, overall there is just shy of an 11% increase in goals in the second-half of Premier League games.
Championship
Whilst the quality of the Premier League is at the top-level of world football, there is obviously a slight drop-off down to the Championship. With the English second-tier’s best teams, the level is still pretty high. As you go down the division, however, it obviously becomes poorer and poorer quality. Does that mean that teams are more likely to score in the first-half of matches, or does the overall percentage of first-half and second-half goals remain pretty much the same regardless of the league?
For the sake of consistency, we have looked across the same five seasons of football and collated the same statistics that, for the Championship, are as follows:
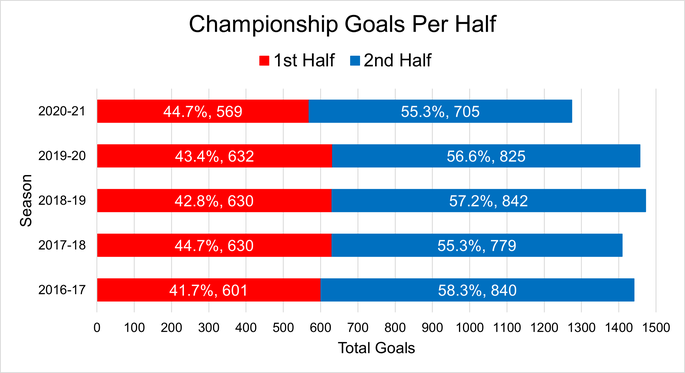
What is immediately apparent is that more goals are scored in a Championship season than a Premier League campaign, but that isn’t all that surprising when you consider that there are more teams that play in the second-tier and therefore more matches. It is also why the percentages are helpful as they help us to identify whether there are more goals netted in the first 45 minutes of a game or the second 45. On that front, the two divisions are a lot closer together.

It is still very much the case that it is the second-half of a football match that sees the most goals scored, with 56.59% netted in the Championship compared to the 43.41% of goals in the first-half. Or put another way, the second-half of games in the second-tier sees around 13% more goals scored than the opening period of play. That is more than 2% more goals scored in the second-half than in the Premier League.
League One
League One is arguably the most interesting of divisions in the Football League, neither vying for promotion to the promised land of the Premier League nor fearing dropping out of the Football League altogether as League Two clubs tend to do. Instead, it simply seems to exist, with the clubs that populate it knowing that they’re far from both the richest of the top-flight and the existential crisis of life in the bottom tier. Does that lead to more excitement and goals in the first-half?
Once again we’ve looked at the same five seasons and provided the same stats. One thing that is worth remembering is that the 2019-2020 season is a little different on account of the fact that the season was brought to a premature close owing to conditions around the world at the time.
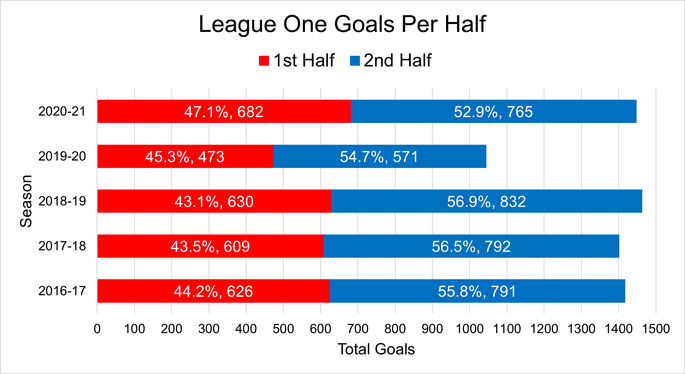
Though fewer games were played in the 2019-2020 season, it is interesting to see that the percentage information confirms that it didn’t make a massive difference in terms of whether or not the first-half saw more goal action than the second-half of matches.

The answer, once again quite resoundingly, is that the second-half of games is what to watch if you want to see the most goals. Interestingly, League One is closer to the Premier League’s total of just shy of 11% more goals being scored in the second-45 of matches.
League Two
The final division that it is worth looking at is that of League Two, the bottom tier of the Football League. There is certainly more jeopardy for sides that reside in the lowest division, given that relegation would mean their removal from the Football League altogether. Does that mean that teams are more likely to shut up shop in the opening 45 minutes of games and try to keep things tight, or approach games with a wild abandon as they seek to get three points that could see them stay in the league?
As with the other three divisions, we’ve looked at the same stats across the same five seasons of football. League Two also saw the 2019-2020 campaign brought to a premature end because of world events, which is why the percentage information is so helpful to bear in mind:
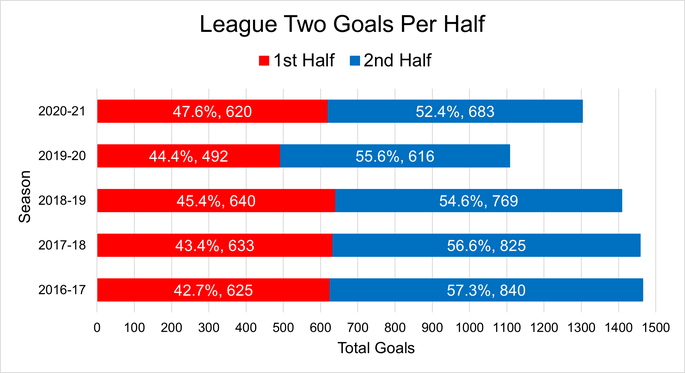
The immediate thing that jumps out from those stats is that League Two is just like the rest of the football played in the English Football League, insomuch as more goals are scored in the second-half of games than the first-half.
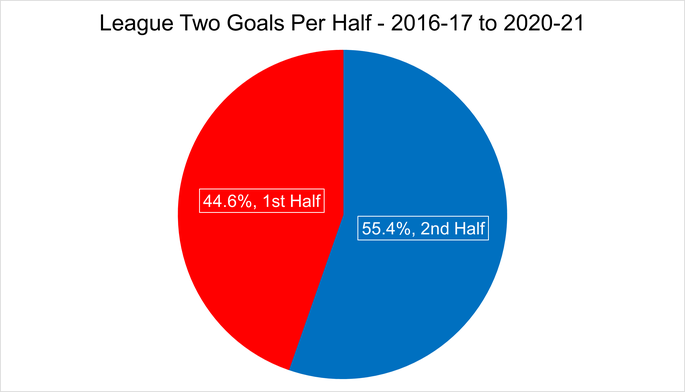
It is also interesting to note that the Championship appears to be the outlier, with the 13% difference between goals in the opening half and the closing one. League Two, as with League One and the Premier League, sees just shy of an 11% increase in goals in the second period.
How The Leagues Compare
Though we’ve mentioned this as we’ve been going, it is worth having a direct comparison of the four divisions of English football. Here we’ll look at the total number of goals scored in the first-half for each league, as well as the total number scored in the second-half and what percentage of the overall number of goals scored that amounts to:
Goals Per Half Across the English Leagues
| League | 1st Half | 2nd Half | Total | Diff. (1st – 2nd) |
|---|---|---|---|---|
| Premier League | 2323 (44.6%) | 2889 (55.4%) | 5212 | +10.8% |
| Championship | 3062 (43.4%) | 3991 (56.6%) | 7053 | +13.2% |
| League One | 3020 (44.6%) | 3751 (55.4%) | 6771 | +10.8% |
| League Two | 3010 (44.6%) | 3733 (55.4%) | 6743 | +10.8% |
| Total | 11415 (44.3%) | 14364 (55.7%) | 25779 | +11.4% |
When put in such a stark manner as this, you can see how much of an outlier the Championship is when compared to the other leagues. The stat of 13.2% more goals scored in the second-half of games compared to the 10%ish more goals scored in the other divisions really stands out. Even so, it remains clear that the second-half of games is where the real action is in terms of goals, even if both halves of games tend to have their fair share of goalmouth action.
How Many Goals Are Scored Per Half, On Average?
Now that we know which half of football contains the most goals across the course of a season, it is worth researching how many goals are scored per half, on average. Obviously the ‘average’ part of that is what makes it a little complicated, when you consider that one game could feature four first-half goals another none, but the average would be two per match. Still, it at least serves to give us a sense of roughly how many goals we should expect to see during the course of two halves of football.
We have decided to stick with the same five seasons of football, for obvious reasons, but this time we’ve added in information about the average number of goals scored by the home side and the away team over the course of the season. We will also tell you the total average number of goals scored in a match during the campaign in question, as well as looking at the summation of each of those categories over the five seasons we’ve looked at.
Premier League
As always, we’ll start with the top-flight of English football. At the time of writing, and across the five campaigns that we’ve investigated, the Premier League features 20 teams. Obviously some of those teams are better than others, with Manchester City and Liverpool being the dominant forces during the period of time that we’ve looked at. Here is how the data looks for each of those seasons:
Premier League Average Goals Per Half Per Game
| Season | 1st Half | 2nd Half | Home | Away | Total |
|---|---|---|---|---|---|
| 2016-2017 | 1.22 | 1.58 | 1.60 | 1.20 | 2.80 |
| 2017-2018 | 1.12 | 1.56 | 1.53 | 1.15 | 2.68 |
| 2018-2019 | 1.25 | 1.57 | 1.57 | 1.25 | 2.82 |
| 2019-2020 | 1.25 | 1.47 | 1.52 | 1.21 | 2.72 |
| 2020-2021 | 1.27 | 1.42 | 1.35 | 1.34 | 2.69 |
| Total | 1.22 | 1.52 | 1.51 | 1.23 | 2.74 |
The first thing that jumps out from the data is that the same number of goals were scored on average in the first-half of matches as were scored by the away team during the 2018-2019 season, whilst the home team scored the same number of goals on average as were scored in the second-half during the same campaign. That kind of quirk didn’t happen at any other point across the five seasons that we’ve looked at, which is what makes it such an unusual thing to make notice of.
It is also worth noting that it is not as if there is a huge difference between the average number of goals scored in each period of the game. Yes, there are more goals scored on average during the second-half of Premier League games, but it is still kept below two goals per game, on average. With just shy of three goals scored per game during the season, it would not be outrageous to assume that the outcome of a match is likely to be 2-1, should a game stick within the parameters of the average number of goals scored, with one goal scored in the first-half and two in the second.
The Championship
Having looked at the Premier League, it is now worth having a peak at the data for the Championship to see if it differs hugely from the top-flight. We know that the Championship saw about 13% more goals scored in the second-half of matches across the five seasons that we’ve been looking at, but how does that translate to the average number of goals scored data?
Championship Average Goals Per Half Per Game
| Season | 1st Half | 2nd Half | Home | Away | Total |
|---|---|---|---|---|---|
| 2016-2017 | 1.09 | 1.52 | 1.50 | 1.11 | 2.61 |
| 2017-2018 | 1.14 | 1.41 | 1.41 | 1.14 | 2.55 |
| 2018-2019 | 1.14 | 1.53 | 1.52 | 1.15 | 2.67 |
| 2019-2020 | 1.14 | 1.49 | 1.41 | 1.23 | 2.64 |
| 2020-2021 | 1.03 | 1.28 | 1.25 | 1.06 | 2.31 |
| Total | 1.11 | 1.45 | 1.42 | 1.14 | 2.56 |
The same stranger quirk of statistics that happened in the Premier League during the 2018-2019 season also happened in the Championship in 2017-2018, with the first-half goals aligning with the away team and the second-half goals matching with the home team as an average over the course of the five campaigns. Though the second-half did see more goals scored, it wasn’t as big a leap as we might have expected, given what we knew about the total number of goals scored each period over the five campaigns.
League One
In the information about the total number of goals scored in the first-half and second-half during a season, we know that League One is more closely aligned with the Premier League than either of the divisions to the sides of it. Does that also seem to play out in terms of the average number of goals scored each half?
League One Average Goals Per Half Per Game
| Season | 1st Half | 2nd Half | Home | Away | Total |
|---|---|---|---|---|---|
| 2016-2017 | 1.13 | 1.43 | 1.46 | 1.11 | 2.57 |
| 2017-2018 | 1.10 | 1.43 | 1.38 | 1.16 | 2.54 |
| 2018-2019 | 1.14 | 1.51 | 1.43 | 1.22 | 2.65 |
| 2019-2020 | 1.18 | 1.43 | 1.50 | 1.11 | 2.61 |
| 2020-2021 | 1.24 | 1.39 | 1.35 | 1.27 | 2.62 |
| Total | 1.16 | 1.44 | 1.42 | 1.18 | 2.60 |
Once again it is the second-half that saw the most goals scored in League One, this time bringing the average down a little bit in the second period when compared to the Championship. With around 2.5 goals scored per game across the course of five seasons, you could maybe expect to see a few more 1-1 draws in League One than in the top-flight. Indeed, the statistic suggest that it is likely to be closer to the Championship in terms of scorelines when the season is looked as a whole.
League Two
With League Two being closer to the Premier League and League One in terms of when the goals are mostly scored, it will be interesting to see if that is also how things appear in terms of the average number of goals scored per half. With League One also avoiding the curious statistical anomaly that the top two divisions of English football suffered from, will we see it return in the bottom league?
League Two Average Goals Per Half Per Game
| Season | 1st Half | 2nd Half | Home | Away | Total |
|---|---|---|---|---|---|
| 2016-2017 | 1.13 | 1.52 | 1.42 | 1.23 | 2.65 |
| 2017-2018 | 1.15 | 1.49 | 1.48 | 1.16 | 2.64 |
| 2018-2019 | 1.16 | 1.39 | 1.42 | 1.13 | 2.55 |
| 2019-2020 | 1.12 | 1.40 | 1.40 | 1.12 | 2.51 |
| 2020-2021 | 1.12 | 1.24 | 1.26 | 1.10 | 2.36 |
| Total | 1.14 | 1.41 | 1.40 | 1.15 | 2.55 |
Whilst League Two does indeed avoid the statistical quirk of both the Premier League and the Championship, it has one of its own: the average number of goals scored by away teams was 1.42 in both 2016-2017 and 2018-2019. In general, League Two’s average number of goals scored across 90 minutes was not far off the Championship, though League One was closer to the Premier League. Regardless, the second-half sees the most goals scored on average.
Average Goals Per Half Across the Divisions
Just as with the number of goals scored in each half of football, it is helpful to take a closer look at the divisions alongside each other to gain a clearer sense of which ones bear the closest similarities. As a result, we’ll look at the total average first-half goals, average second-half goals, average home and average away goals as well as the total average goals scored across all four divisions here:
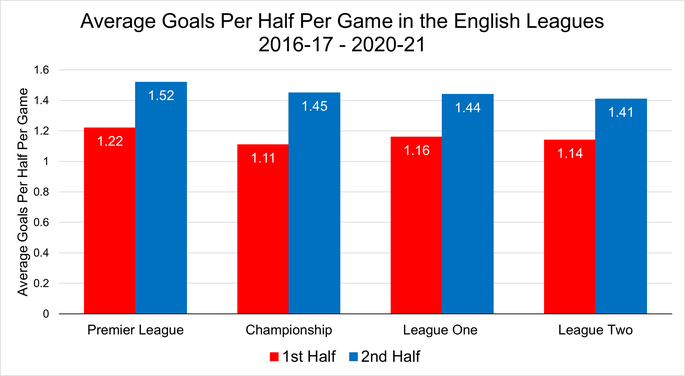
The data there is the same as at the end of each season individually, but viewed alongside each other you can see some stark differences between the leagues. You can see how much both the Premier League and League One stand out from the others, for different reasons, for example, as well as how exciting the top-flight is compared to the other divisions in the English Football League system. The extent to which second-half goals are more likely than first-half goals stands out, too.
Why Do Second-Halves See More Goals?

Having established that the second-halves of matches see more goals irrespective of the division in question, it is worth considering why that might be the case. The first reason, which is also the most obvious, is that teams tend to tire at games wear on. As a result, defences are more likely to make mistakes and present attacks with opportunities to score, which are often taken up rather greedily. When you consider that teams are also more likely to make attacking substitutions than defensive ones, this makes sense.
That is to say, managers don’t tend to like to break up defences in games as it often leads to miscommunication, so it is more likely that they will look to freshen up their attacks. When this happens, a new attacker that is just on the pitch and therefore not as tired as most of the other players is able to attack a defence that will be tired, both mentally and physically. The result of this is often goals being scored, but it is more likely to happen late in matches when changes have been made.
The other big reason why the second-half sees more goals than first-halves tend to be that teams will become more attacking as the match wears on. Whether that is because they are chasing a deficit or because they need to win, sides are more likely to push forward towards the end of halves and therefore leave spaces in behind. These spaces can be exploited by teams, leading to more goals being scored after the second-half has got underway rather than in the opening period.
Of course, another way of looking at this is by asking why fewer goals are scored in the opening 45 minutes of matches, with the answer being two-fold. For starters, teams are much fresher in the first-half and therefore defences and goalkeepers are much more alert to what is going on. Secondly, teams have a point each when matches get underway and are at 0-0, so there is more of a sense of something to lose than when matches are reaching their conclusion and sides will feel as though they have something to gain by scoring.